Traders and long-term investors use technical, fundamental, and sentimental analysis to identify entry and exit positions. They do this with a view of entering and exiting the trades at the right time.
Unfortunately, there is no definitive system that can accurately tell a trader when to enter or leave a trade. This is simply because the market is controlled by people who have different ways of reacting to their emotions.
There are many tools that can help you in your daily activity of trader. One of the most popular and used are undoubtedly the Bollinger Bands.
Bollingers Bands: Definition and Meaning for Traders
Bollinger bands have become important trend indicators. So traders use them to identify a market that is trending.
This tool was developed by John Bollinger in the 80s. Today, they have become some of the most common indicators in the industry. Traders use them to identify a trend by checking overbought and oversold positions.
The concept of Bollinger bands come from Standard Deviation, which is a statistical calculation or unit that measures the dispersal pattern of any data. It includes about 68 per cent of all data points for the normal distribution pattern. Two standard deviations include roughly 95% of all the data points.
How to calculate
The calculations behind the Bollinger Bands concept are really long and traders used to calculate them in the past. Today, this has changed with the introduction of automated trading.
As such, one needs not to understand the background but the concept behind it. In fact, only a very few traders have the knowledge about the mathematical background of the Bands.
Here’s how bands are calculated:
- The first step in calculating Bollinger Bands is to find the simple moving average of the asset in a certain period. The most popular period is 20 days. You can easily tweak that to match your trading strategy.
- The next step is to find the two standard deviations of this simple moving average. You can calculate the upper band as MOV20+(2*20Standard Deviation of Close). Also, you can calculate the lower band as MOV20-(2*20Standard Deviation of Close).
The chart below shows how Bollinger bands look like in a real trading chart.
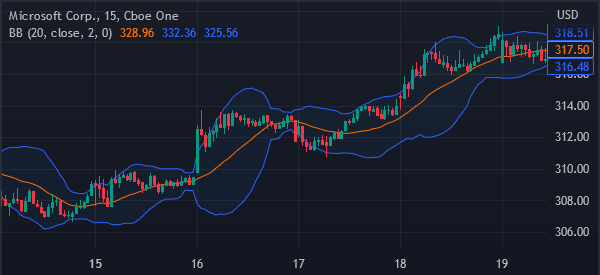
When using the Bollinger bands, the area between the moving average (MA) line and each band is known as the orchannel. The orchannel is important because it produces a range. The MA line is the middle line.
In addition, the area between the moving average line and the above line is the buying channel.
The Buying Channel
It is a buying channel because the spot rates displayed have a higher moving average which suggests an upward momentum. On the other hand, the area between the moving average line and the line below is known as the buying channel because they trade below the moving average.
Therefore, a downward momentum is suggested.
In the example shown below, the currency pair continued to move upwards through the buy channel until the May 23rd, where the trend started to weaken. This shows clearly that the average rate and the spot rate are converging meaning that the trend momentum is slowing down.
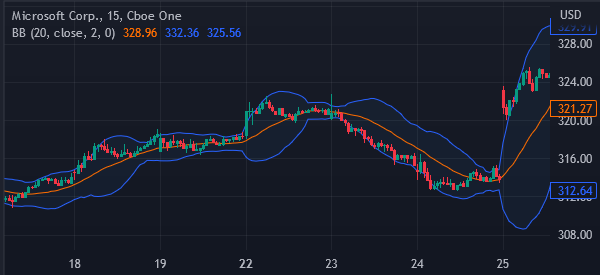
When the indicative price fall above or below the bands, the resulting situation is known as the ‘breaking the bands’.
Bollinger Bands trading strategies
Volatility and reversals when using BB
As a trader, knowledge on volatility is very important. This is because intelligent traders make more money during volatile situations than they do during range situations. For newbies, volatility is the worst time to trade because it exposes their accounts at risk.
Simply described, volatility is the degree by which the price of the item varies over time. In addition, volatility increases sharply when a reversal is nearing. Bollinger bands show quite a bit of volatility through the width of the bands.
When the bands are very wide, it means that volatility is high and when the bands are very close, it is an indicator of low volatility.
Using Bollinger Bands to show reversals
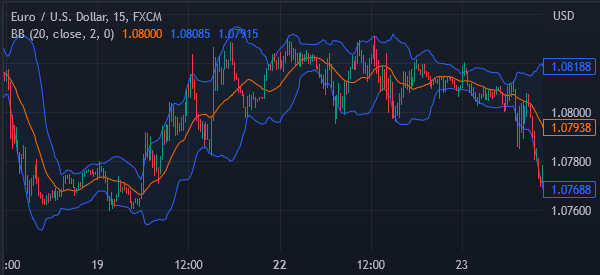
The chart above is a good indication of how Bollinger bands can be used to show reversals. When the market price of the EUR/USD pair falls outside the bands, the ‘breaking the bands’ scenario comes out.
This scenario happens during periods of extreme volatility.
As explained earlier, two standard deviations show 95% of all the data while the market rates break the bands about 5% of the time. In a double top situation, a trend reversal is common. It simply indicates that the market is resisting further price increases which means that the pair is overbought.
Therefore, a sell signal is indicated when there is this scenario.
On the other hand, a double bottom position indicates an oversold position. Therefore, investors at this position want to close their sell positions and buy.
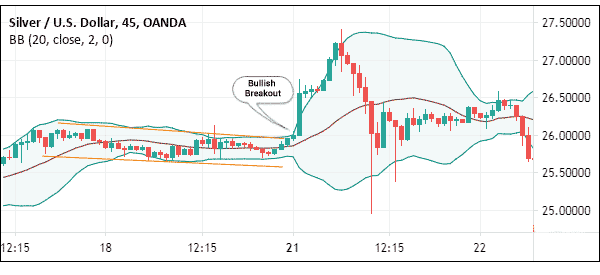
Using Bollinger Bands to identify breakouts
Another strategy for using Bollinger Bands is to identify breakouts. A breakout is a period where the price of an asset suddenly moves in either direction after a period of consolidation.
Ideally, you can predict when a breakout is about to happen by looking at the formation of the Bollinger Bands. When the bands are squeezed, it is often a sign that a breakout will happen.
Still, the biggest challenge is identifying the direction of the breakout. To do this, we recommend that you use other tools or strategies to predict the direction. For example, if the Bollinger Bands squeeze is happening at a period when there is a bullish pennant or flag, it could be a signal of a bullish breakout. A good example of this is shown in the chart below.
Using BB in trend following
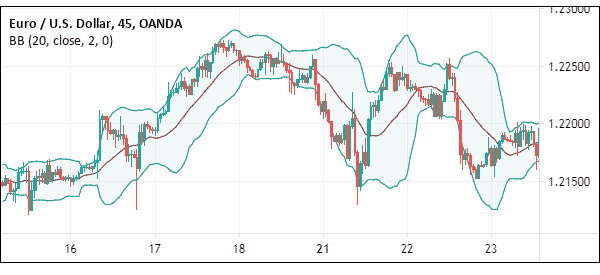
Another strategy of using Bollinger Bands is in trend following. This is a strategy that involves buying when other traders are buying and selling when others are selling (basically, you will follow the crowd). It involves jumping into the bandwagon of an already-existing trend.
To do this, traders look at two lines: the middle and the upper one during an uptrend and the middle and the lower one during a downtrend. The idea is that during an uptrend, the price will move with the Bollinger Bands.
A bearish signal emerges when the price moves below the middle line of the bands. A good example of this is in the EUR/USD pair below.
Indicators to combine with Bollinger Bands
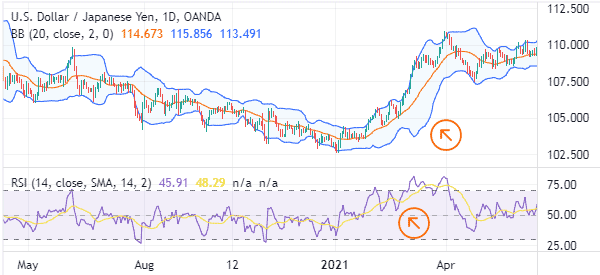
One way of trading using Bollinger Bands is to combine it with other indicators. We recommend that you combine it with oscillators like MACD, Stochastic, and the Relative Strength Index (RSI).
For example, as shown below, the Relative Strength Index kept rising together with the Bollinger Bands. With this, you can also identify when reversals are about to happen.
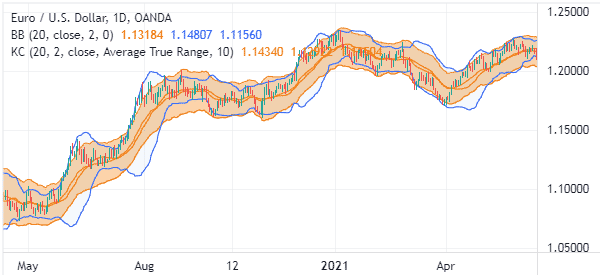
Bollinger Bands vs Keltner Channel
Bollinger Bands are often confused with Keltner Channels because of their close resemblance. In fact, it is often difficult to tell the difference between the two indicators when they are applied in a chart.
The difference between the two is that Keltner channels use the Average True Range (ATR) during its calculation while Bollinger Bands uses standard deviation.
The two are used in the same way in trading. The chart below shows the EURUSD with Keltner Channels and BB.
BB vs VWAP
Bollinger Bands is a significantly different indicator to a VWAP. For starters, VWAP stands for Volume-Weighted Average Price. It is an intraday indicator that looks at the average price of an asset when compared to its volume.
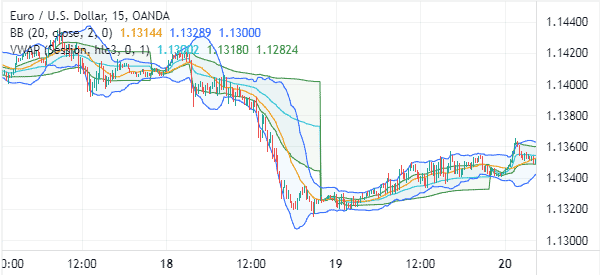
The chart below shows the VWAP indicator and BB applied on the 15-minute chart of the EUR/USD.
Bollinger Bands vs moving average
Bollinger Bands are different from moving average. For one, Bollinger Bands are created using moving averages. Also, the middle line of the Bollinger Band is the moving average.
It is possible to use the two indicators interchangeably. For example, you could use the two in trend following and to find reversals.
Key Take Away
In conclusion, it is important to note that Bollinger Bands are just one part of trading. A trader needs to put into consideration a number of issues such as the overall market environment.
It is also prudent for one to use a combination of indicators when making an investment decision.
Other useful resources
- Bollinger Bands – Official Site
