
Technical and fundamental analysis are the two most commonly used methods of identifying entry and exit positions.
Technical analysis uses past performance to give an indication of how the market will perform in future. On the other hand, fundamental analysis combines the past news and economic events with the present and future expectations. In the two, many models have been developed to help investors simplify their trading.
Moving Averages (MA), some of the most common technical indicators today
Moving averages look at the past opening, closing, high, and low prices of an instrument such as a currency pair and then conducts an analysis into its average price in a particular time. The change in the instrument’s price will lead to a change in the moving average.
There are 5 main types of moving averages which include:
- simple moving average (SMA)
- exponential moving average (EMA)
- smoothed moving average
- weighted moving average (WMA)
- triangular moving average (TMA)
In addition, a moving average of a moving average can also be used. While these moving averages are relatively similar, the key difference between them is the weight assigned to the most recent price data. SMA applies an even weight to all the prices while the exponential and weighted moving averages place more weight to the most recent data.
On the other hand, the Triangular Moving Averages (TMA) apply more emphasis to the data in the middle of the data set. Finally, the variable moving average (VMA), presses more weight on the volatility of the price.
In the past, traders had to spend time calculating the moving averages. This was a tedious activity since MA are better used alongside other technical indicators. Today, this has changed with the introduction of automated trading systems which just incorporate them.
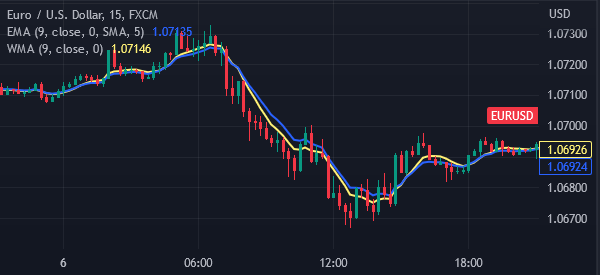
The chart below shows a 15 minute EURUSD chart (red) analysed by exponential MA (blue), and the weighted one (yellow).
The Time aspect
The success or failure of using moving averages depend on a number of factors. For instance, since they use past data to make judgement, it is impossible for it to forecast economic numbers. Therefore, when economic data is released, the chart will move either up or down despite what the moving average shows.
Another important aspect is time. Traders who place intraday trades prefer to use short term moving averages while those who have a long time horizon prefer using the long term one.
The table below shows the main moving averages time frames
| Very short term (for intraday traders) | 5-13 days |
| Short term | 14-25 |
| Minor intermediate | 26-49 |
| Intermediate | 50-100 |
| Long term | 100-200 |
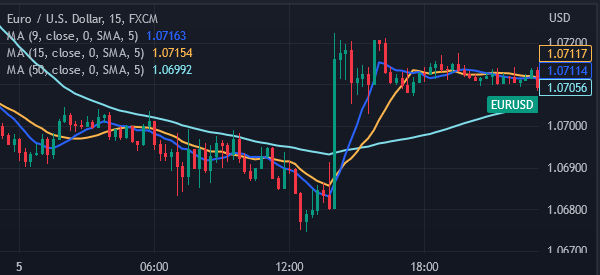
The chart below shows a 9, 15, and 50 day simple moving average for the EURUSD pair shown above.
More useful external resources
- How to Use a Moving Average to Buy Stocks – Investopedia
- Simple Moving Average – Top 3 Trading Strategies – Tradingsim
