Moving Average (MA) is an important technical indicator that is used by most day traders and investors. It is the most widely-used indicator globally and has even been used to build other indicators like Donchian Channels and Bollinger Bands.
Moreover, this tool is quite versatile and can also run with different timeframes. In this article, we will explain what the 200-day moving average is and how to use it in day trading.
What is a moving average?
A moving average is an indicator that seeks to find the average price of an asset in a certain period of time. The idea is simple. For example, if the price of an asset has traded at $10, $12, $14, and $15 in a four-day period, then the average of this price is $12.75.
Therefore, if the price suddenly rises to $20, we can assume that the overall price is overvalued. On the other hand, if the price moves below $4, it can be perceived as if it is getting undervalued.
The concept of moving averages was seen widely during the Covid-19 pandemic. At the time, people used to look at the moving average of the number of cases to see whether the trend was moving in the right direction or not.
Types of moving averages
There are several types of moving averages. These multiple types attempt to solve the fact that the initial MA has some gaps and lags. For example, finding a simple moving average of a 200-day period may result in a major lag. Examples of moving averages are:
- Simple moving average (SMA) – It is the most basic MA and it tends to take all days or periods equally.
- Exponential moving average (EMA) – EMA removes the lag by putting more weight on the most recent data.
- Volume-weighted moving average (VWMA) – This MA removes the lag by focusing on the asset price and including volume in its calculation.
- Smoothed moving average (SMMA) – This is usually a modified version of the EMA since it has a longer period.
- Weighted moving average (WMA) – This MA also puts more emphasis on the most recent data.
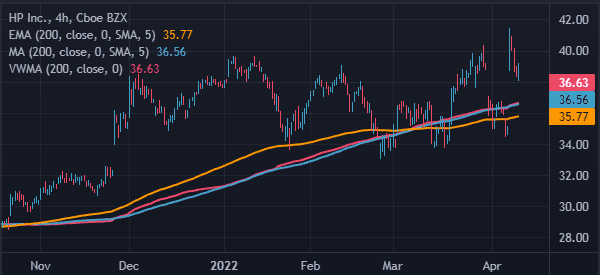
Other types of moving averages are Least Squares, Arnaund Legaux, and Moving Average Ribbon among others. The chart below shows HP stock with a 200-day SMA, EMA, and VWMA.
What is the 200-day moving average?
With what we have discussed above, explaining what a 200-day moving average is is a bit easy. It is an MA that focuses on the 200-day period.
For assets like cryptocurrencies that trade on a 24/7 basis, this average covers all the past 200 days. On the other hand, for stocks that open for 5 days a week, the 200-day MA focuses on the past 200 trading days.
How to calculate the 200-day MA
Calculating the 200-day Moving average is relatively easy although it depends on the type of MA you are using. Let us look at a few examples.
To calculate the VWMA, you first need to first assign a weight to each period, with the most recent day getting more of it. Then, multiply each price by the assigned weighting factor and add them. Finally, divide the answer by the sum of the periods to the WMA.
To calculate the EMA, you first need to do an initial sum of the 200-day period and then divide the sum by 200. Next, establish a multiplier to use. Finally, calculate the EMA by using this formula:
| [close – EMA (previous day)] x multiplier + EMA (previous day) |
The simple moving average is even simpler to calculate. First, gather the prices of the 200-day period. Then, calculate the first day of the 200-day SMA using the first data.
For example, if the cloning price are 10,12, 13, 14, and so, on, the first day SMA will be (10+12+13+14) / 200. Then the second day will start at 12.
How to read the 200-day MA
So, how do you read the 200-day Moving average? The answer to this is simple.
Ideally, when a price is above the 200-day MA. it is often said to be a good time to buy and hold an asset. In this case, when it moves below the MA, it is often a good time to exit a bullish trade because it signals that bears are taking over.
Obviously, this is a highly simplified version and the situation tends to depend on market conditions.
» Related: The Best Entry and Exit Indicators
200-moving average strategies
Death and golden cross
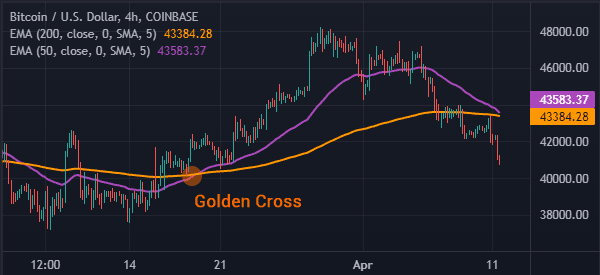
Two of the most popular aspects of moving averages are known as golden and death cross. These are popular trading strategies that people use when relying on the 200-MA. It involves combining a 50-day and 200-day moving average in the same chart.
If the two lines make a crossover at a lower price, it is known as a golden cross. If they cross each other at a higher price, it is known as a death cross. The chart below shows how a golden cross looks like.
Support and resistance
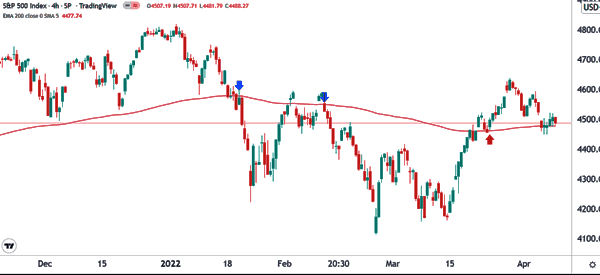
Another strategy for using the 200-MA is to find support. This approach is mostly used when analyzing indices like the S&P 500 and the Dow Jones. It can also be used to analyze other types of assets like stocks and commodities.
The most ideal situation is to add a 200 MA on a daily chart of an asset. If the price moves below the MA, then it is a bearish sign since this average is acting as the support. On the other hand, if the price rises above the MA, it has moved above the resistance.
Examples of these are shown below.
Who can use the 200-day MA?
Unfortunately, the 200-MA is usually an unreliable indicator to use by day traders and scalpers. That’s because day traders tend to rely on extremely short timeframes. As such, a 200-day moving average is usually a long period to use.
Instead, these traders focus on shorter moving averages like 14 and 7. The same concept applies to swing traders. Instead, the 200-MA is mostly used by long-term investors.
Summary
In this article, we have focused on what the 200-MA is and how it works. We have also identified some of the top strategies for using the indicator and some of its limitations.
External useful resources
- Does moving average still give profitable trade? – Quora
