A Step-by-Step guide to Master Technical Analysis like Pros? To make it as a trader, there are a few things you must always have:
- The passion to wake up every day and follow the financial news and watch the charts.
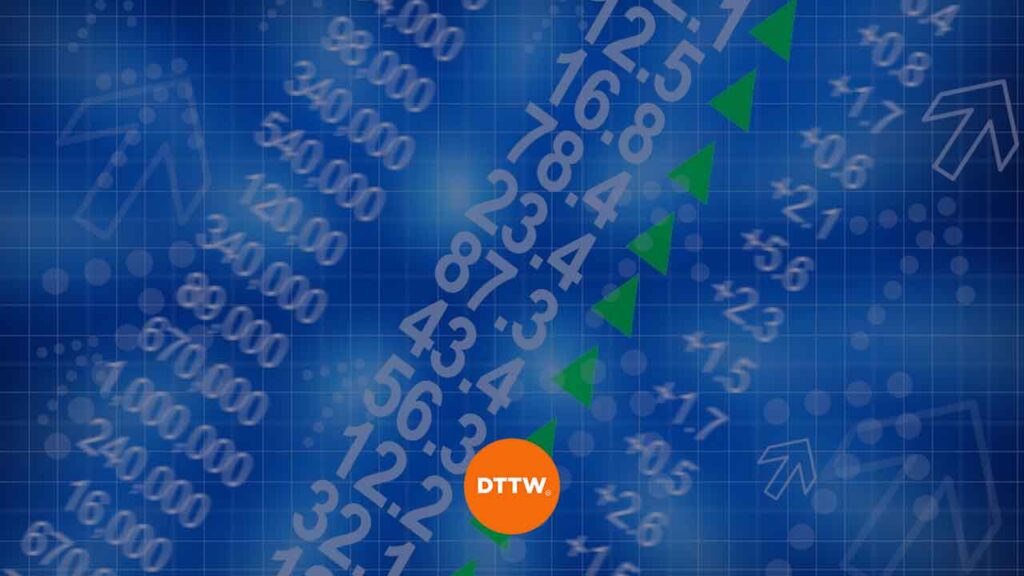
- Always be prepared to learn how to watch and interpret economic data.
- Learn how to use technical indicators (here the most common).
- Be patient enough because most times, despite excellent analysis, your trades might fall short.
In this article, We will focus on technical analysis and explain the best way to become a master.
What is it and how to start a Technical Analysis
Technical analysis is the process of applying complex mathematical models to predict the short and long term movements of asset prices. There are thousands of technical indicators in use today.
Fortunately, to apply the technical indicators, you don’t need to spend time learning about their underlying mathematical models.
Instead, you only need to know how to apply and interpret them.
To become a successful technical analyst, you first need to know how to apply trending analysis indicators. This will help you know whether the asset is starting a trend.
There are many trend analysis indicators you can use including:
These indicators help you to know when a trend is starting.
By knowing this, you can easily enter a trade and make money as the trend continues.
Why Technical Analysis is so important
After identifying a trend, you should not enter before you do another type of analysis!
This analysis is important because it helps you identify the key areas of the trend. These indicators are known as oscillators and they help traders confirm the trends.
Examples of these indicators are:
- relative vigor index
- bulls power
- bears power
- relative strength index
- MACD
- stochastics
Essentially, these indicators help you confirm a trend.
For example, the relative strength index shows when a financial asset is oversold or overbought. In other words, when you have to sell if the trend indicators are in line with it.
Identify the Entry and Exit positions
The final part of any technical analysis is to identify the exact positions to enter or exit the trades.
After knowing that a trend is forming and after confirming it, the next thing is to know exactly where you will enter and exit the trade.
In other words, you will need to know where to buy or sell, and put a stop loss and a take profit.
A good method of doing this is using the Fibonacci Retracement levels. These are well-calculated lines that help you know where exactly the pair will go.
Apply your analysis
To learn how to apply technical analysis, there are many books you can try. We recommend that you use any book by Alexander Elder and Kathy Lien. There are also many websites you can use but we recommend you use Baby Pips.
There are also other mobile apps you can use.
For example, to learn more about candlestick patterns, We recommend you use an android app called JCP. The app gives you all the education and tests you need to become an excellent candlesticks trader.
How to be a Master at Technical Analysis – Useful Tips
- Learn from basic on Fidelity
- Discover more about Technical Analysis on Forexkarma
