Moving averages are the most popular technical indicators in both trading and investing. They have also been used to derive other trading indicators like Bollinger Bands and the MACD.
They are a very versatile tool, so they can be applied to many different settings and combined with other indicators. Even with itself, but with a different length, as we will see further down in our analysis of strategies.
In this article, we will focus on what the 50-day moving average is, why it is so popular, and some strategies to use.
What are moving averages?
A moving average is a technical indicator that aims to identify the average price of an asset in a certain period of time. A good way to explain what moving averages are is to look at the data that used to come out during the Covid-19 pandemic.
In addition to the daily Covid-19 cases, many countries used to also include the 7-day moving average. As such, if the daily case count is 10,000 and the 7-day MA is 4,000, it means that the situation is getting worse. Similarly, if the daily count is 4,000 and the 7-day average is 15,000, it could be a sign that the situation is improving.
The same concept applies in the financial market. If a stock is trading at $10 and the 7-day moving average is at $6, it means that it is getting overvalued.
Types of moving averages
As mentioned, moving average tends to identify the average price of an asset in a certain period. While this concept works, there are several approaches to identifying the same figure. For example, the Simple Moving Average (SMA) takes all periods the same.
Therefore, if you are doing a 200-day moving average, all periods in this case will be the same. Many experts have a challenge with this situation since the overall weight of the data should be skewed towards the most recent events.
As such, there are several types of moving averages that seek to solve this challenge:
- Exponential moving average (EMA) – EMA is a type of MA that implies more weight on the most recent financial data.
- Least square moving average (LSMA) – This is a type of MA that calculates the least squares regression line for the preceding time period.
- Smoothed moving average (SMMA) – This is a type of MA that assigns more weight to price data over a long period of time.
- Volume-Weighted Moving Average (VWMA) – This is a type of MA that also includes the concept of volume in how it is calculated.
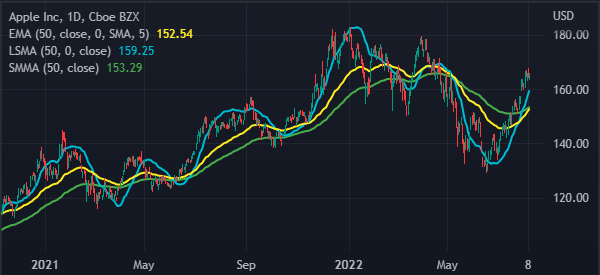
As a result, these indicators usually show different results when applied in a chart. The chart below shows the different types of 50-day moving averages.
What is the 50-day moving average?
The 50-day moving average simply refers to an MA that looks at the previous 50-day period. For example, in cryptocurrencies, which are traded on a daily basis, the 50-day MA will account for all the previous 50 days.
However, for stocks that are traded for five days a week, the 50-day moving average refers to the previous 50-trading days.
Meanwhile, when looking at a hourly chart, the 50-period moving average will refer to the previous 50 hours and so on.
Related » How Many Timeframes Should You Use?
50-day SMA vs 50-day EMA
A common question is on the difference between the 50-day SMA and the 50-day EMA. As mentioned above, the main difference is on how the two indicators are calculated. The SMA indicator takes all data points equally.
On the other hand, the 50-day EMA puts more weight on the most recent data. The EMA is calculated by first getting the overall simple moving average. In the next stage, the indicator brings the concept of a multiplier and uses the following formula:
| Multiplier: (2 / (Time periods + 1) ) = (2 / (10 + 1) ) = 0.1818 (18.18%) |
Finally, the EMA is calculated by using the following formula:
| EMA: {Close – EMA(previous day)} x multiplier + EMA(previous day). |
50-day moving average trading strategy
There are several strategies that one can use when trading with the 50-day moving average. Let’s analyze some of these trading approaches below.
Trend following
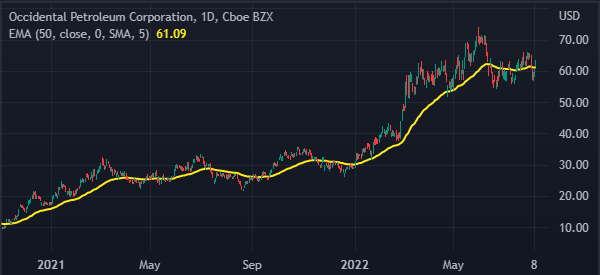
Trend-following is a trading strategy where a trader buys an asset that is in an existing bullish trend or one where they short an asset that is already falling. In this case, the 50-day moving average will be a useful exit point.
The assumption is that financial asset like stocks, forex, and commodities will continue rising as long as they are above the moving average.
As a result, an exit point will be identified when the asset moves below the 50-day MA. A good example of this is shown in the Occidental shares below.
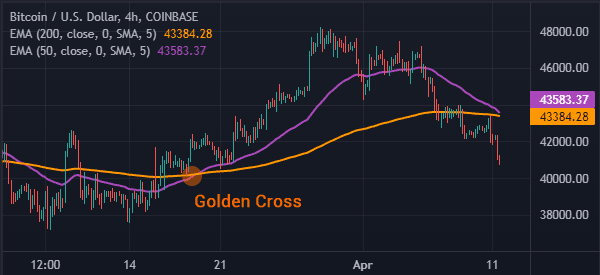
Golden cross
Another popular strategy for using the moving average is known as a golden cross. It is a strategy that involves combining the 50-day and 200-day moving average.
When the two moving averages make a crossover at a lower point, it is usually a sign that bulls have prevailed and that the bullish trend will continue.
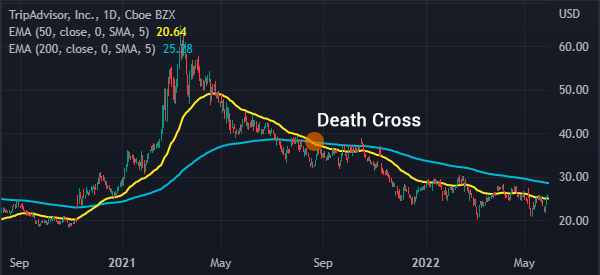
Death cross
Death cross is the exact opposite of a golden cross. It usually forms when the 50-day and 200-day moving averages make a bearish crossover during a downward market. It is one of the most accurate bearish signals to trade.
Support and resistance
Another important approach to use the 50-day moving average with is that of finding the support and resistance point.
Support is a price where an asset fails to move below while resistance is where it struggles to move above.
A move above the resistance is usually a sign that the bullish trend will continue while a move below the support is a sign that the bearish trend will continue.
Summary
The 50-day moving average is an important tool to use in trading and investing. And it is so important to learn how to use it! As we have seen, it applies to many different strategies and different timeframes.
When a bullish asset crosses the 50-day moving average, it usually sends a warning that the bearish trend may be about to end. At the same time, it can be used to identify bullish and bearish crossovers and even continuations.
External Useful Resources
- Why the 50-Day Simple Moving Average Is Popular Among Traders – Investopedia
