A 52-week high and low is a relatively simple way of identifying the performance of a stock, commodity, or any other asset. The two levels are some of the most commonly watched points by traders.
Indeed, many apps like Investing, Yahoo Finance, and Webull will regularly send you notifications when a stock rises to its 52-week high or falls to its 52-week low.
This is definitely a great way to filter the stocks (below we tell you how) and focus your trades in few companies, especially if your trading style is oriented to open few of them every day.
Identifying these stocks is not enough though! To avoid mistakes and ruining your trading account, it is also very important to understand what caused the stock to hit the 52 high/low.
What are 52-week high and 52-week lows?
A year has 52 weeks. Therefore, as the name suggests, a 52-week high refers to a period when a company’s shares rises to the highest level in 52 weeks.
For example, assume that a stock started the year at $20 and rose to about $25 by April. Now, if this was the highest level since the previous April, we could say that the stock is in a 52-week high.
Similarly, a 52-week low refers to a situation where a company’s shares tumble to the lowest level in a 52-week period. For example, if we are in November and the stock falls to its lowest level since November of the previous year, then we can say that it is in a 52-week low.
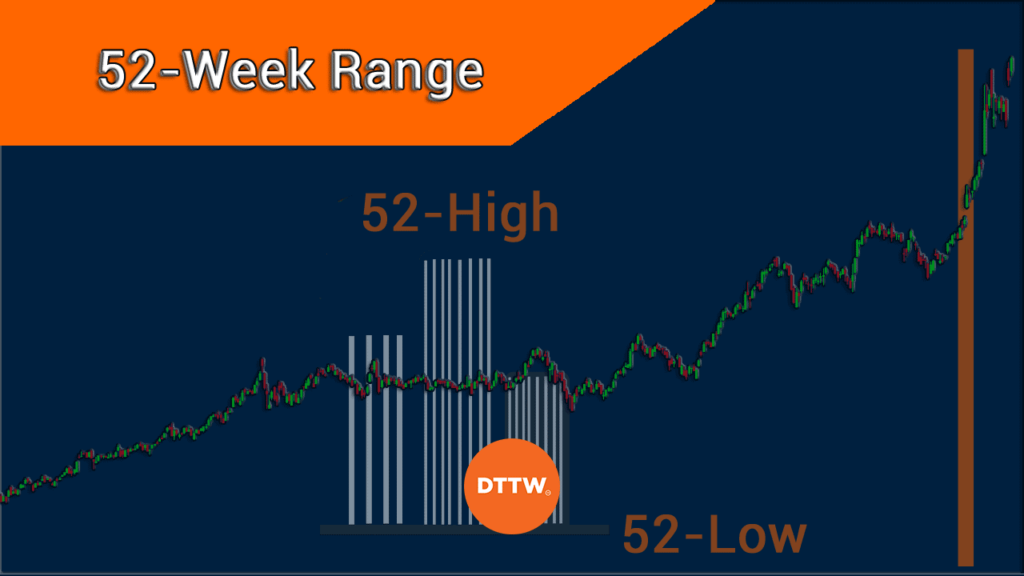
Another concept you will encounter with in the market is a 52-week range. This simply refers to the gap between the 52-week high and the 52-week low.
How to find 52-week high and 52-week low
It is a relatively easy process to find stocks reaching their highest and lowest levels in 52 weeks. The simplest way of doing this is to use a stock screener. Using such a tool will save you a significant amount of time. It will also help you identify stocks that probably you have never heard of.
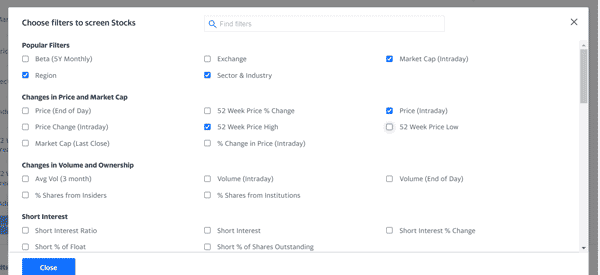
For example, in the chart below, we have selected that we want to see stocks reaching their 52-week highs. These stocks will be from the United States and be in the technology sector.
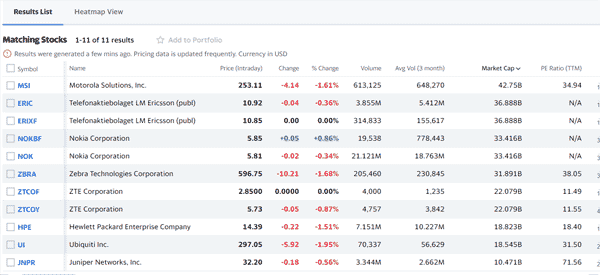
After running the screener, here are the 11 stocks that meet this criterion. They include shares like Motorola Solutios, Ubiquiti, Juniper Networks, ZTE, and Zebra Technologies. On the right side, the screener shows you the range that the stock has been in the 52-week period.
You can repeat the same process if you want to find stocks reaching their 52-week lows.
» Related: How to Trade the Hottest Market Sectors
Why do stocks rise to 52-week high and fall to 52-week lows?
There are several reasons why a stock rises to a 52-week high and why it falls to a 52-week low. First, a stock could climb to the highest level in 52 weeks because of its strong earnings and forward guidance. In most cases, when companies publish strong results, investors will likely push them high.
Momentum of the industry
Second, a stock can rise because of the bullish momentum in the industry. A good example of this is the transition from combustion engines to electric vehicles.
In the past few years, many electric car companies have done relatively well. Indeed, Tesla has now become the biggest electric car company in the world. Other EV stocks that have surged are QuantumScape, Nio, Lucid, and Rivian.
Returns to shareholders
Third, a stock can jump because of favourable returns to shareholders. These types of returns include dividends and share buyback. When companies announce these returns, the stock can react by rising to the highest level in 52 weeks.
Additionally, stocks can jump to 52-weeks simply because of momentum. This refers to a situation where a stock keeps rising for no major reason.
The crash
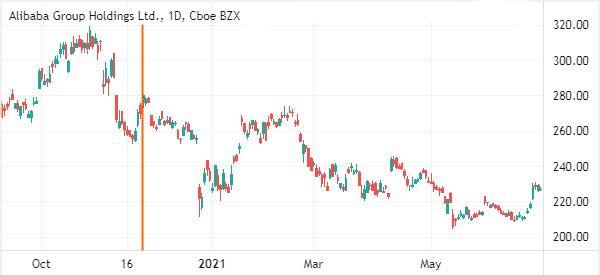
Stocks can crash to their 52-week lows when the opposite happens. For example, it can crash when it reports weak earnings. Also, a stock can drop to a 52-week low when there is a bearish momentum in the industry. For example, as shown below, Alibaba shares crashed to a 52-week low as sentiment in Chinese stocks worsened.
How to use 52-week high and low levels
The 52-week range is important for most traders. Most of them view the 52-week high level as a resistance while others see them as supports.
At the same time, many traders believe in buying stocks that are hitting their 52-week highs. The idea is that these shares have momentum and that they will keep rising.
Similarly, other traders prefer shorting stocks that are hitting their lowest levels in 52-weeks. Still, in our experience, traders should always use these levels just for reference and then conduct other types of analysis.
Another way of trading these levels is known as trend following. For example, you could decide to use the following the trend strategy to analyze the stock.
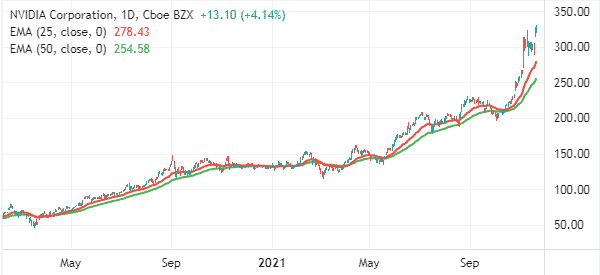
For example, in the chart below, we see that Nvidia stock price has been in an unstoppable bull run. Along the way, it has hit a 52-week high several times.
We have added the 25-day and 50-day moving averages. Therefore, you can assume that the stock will keep rising as long as it is above these levels.
Example of 52-week high
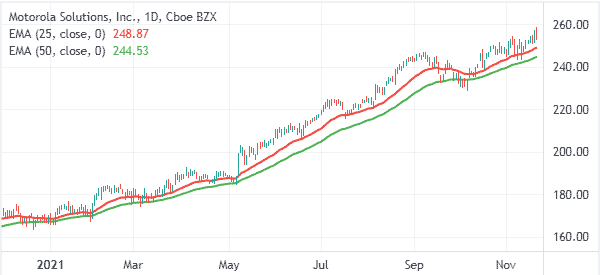
In the screener above, we identified 11 companies based on our criteria. Now, let us look at one of the companies showed there. As shown below, we see that the Motorola Solutions share price has been in a strong bullish trend.
As a result, it has jumped to the highest level in 52 weeks. Indeed, a closer look shows that the stock has jumped to an all-time high. Therefore, as a trader, you could assume that the stock will keep rising and buy it.
A riskier approach would be to short the stock hoping that a reversal will happen. In most cases, going against the grain can be a risky proposition.
Still, at times, you could use several strategies to short stocks that have risen to their 52-week high. For example, you can identify some reversal patterns like head and shoulders and double-top. You could also identify candlestick patterns like bearish engulfing and doji.
Summary
In this article, we have looked at the concept of a 52-week high and a 52-week low. We have also identified how the two works and how to use the two levels. Most importantly, we have shown examples about how to use them.
External useful Resources
- New 52-Week Highs & Lows – WSJ
