Data, data and more data. A trader spends a lot of his time doing research. For a trader there are many important economic trading data to monitor before starting a trade (we also recommend you to check this checklist).
Every day, we receive a myriad of data ranging from jobs numbers to economic growth numbers to inflation.
For example, when the inflation of a country like US moves higher than expected, investors tend to buy the USD in anticipation of higher interest rates. While there is a lot of economic data released every day, all the numbers are usually not the same.
Often, most people ask why all this data matters. In this article, We will highlight the different types of data and why traders should pay close attention to them.
Why all this data matters?
We want to start with a theoretic question. Assume you won a lottery of $1 million. To receive the money, the sponsors of the lottery ask you to invest in either United States or Zimbabwe.
To give a context, United States is the most developed country on earth while Zimbabwe is among the poorest. In the latter, most people don’t have jobs and the situation seems dim by the day.
As a person with common sense, which country would you invest in? Zimbabwe or United States? We assume, you would invest in the United States.
Now, assume the two countries were the United States and Norway. These are two rich countries. In this situation, you will be torn to select because of their growth and prosperity.
To make a decision, you will look at the rate of growth and the direction of the country.
Traders ask these questions on a daily basis. They want to know the best countries to allocate their hard-earned money. To decide on the countries, stocks, and currencies to invest in, they weigh all these facts.
How to find these Economic numbers
The easiest way of finding these numbers is to use the economic calendar. This is a free tool provided by most platforms like Investing.com and Dailyfx that show you when economic data and numbers will come out.
As a day trader, you should ensure that you look at the calendar on a daily basis. Other calendars that will help you are the earnings calendar, dividend calendar, and splits calendar among others.
How to read the economic calendar
The economic calendar is an easy-to-use tool that anyone can use to find data. It has several important sections that you need to look for. First, ensure that you are looking at the period. You can select the exact day or a certain range.
Next, as shown below, the calendar has several sections like time, economic event, actual, forecast, and previous. As the name suggests, the previous figure is what was reported in the prior month or quarter. Forecast is what economists are expecting while the actual figure is what the agency published.
A red actual number means that the reported figure missed expectations while a green one implies that it was better than estimated. For example, in the figure below, we see that Japan’s exports came in at 25.3%, which was lower than the expected 28.1%.
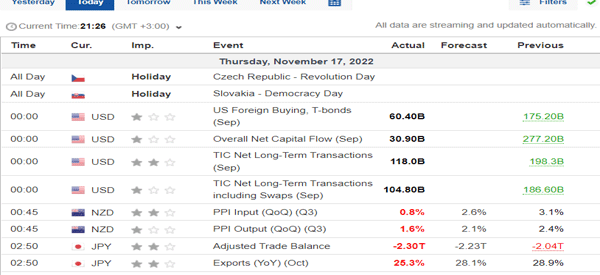
It is worth noting that not al figures in the economic calendar have an impact on currency pairs or stocks. The most important numbers are those that have three stars.
Also, you should always have more information about market conditions. For example, the US may publish strong jobs numbers and then the US dollar fails to react. This happens when the market expects the data to not have important impact on Fed’s decision.
Types of economic data
Inflation
Inflation is one of the mandates of the Federal Reserve and other central banks. For the Fed, the other mandate is to ensure that there is full employment.
When inflation rises a lot, the central banks tend to react by rising interest rates. This helps curtail the excessive lending. When the rate of inflation is so low, the bank reacts by lowering rates, which tends to support spending.
There are a number of measures of inflation that you should focus on, among others:
- consumer prices index (CPI)
- producers purchasing index (PPI)
- consumer spending
- consumer confidence levels
Therefore, you should always look at the inflation numbers.
Interest Rate Decision
In his short documentary on how the economic machine works, billionaire Ray Dalio explained the role of interest rates in the market. When the interest rates are low, people and businesses take credit and buy more.
This fuels inflation has an impact in the financial market.
Therefore, to curb inflation and stabilize the currency, the Federal Reserve increases the interest rates. This data is specifically very important in the financial market because it indicates the economic environment.
FOMC meetings
In the United States, the Federal Open Market Commission (FOMC) is the body mandated to revise the interest rates.
As a trader, you need to always have in mind when the interest rate decision is to be made. It is advisable to avoid the market because no one really knows how the market will react.
In addition, it is important to stay on top by always checking the minutes of the regulatory body and listening to their speeches.
In America, the FOMC is expected to tighten (increase the base lending rate) any time this year depending on the economic data. It is important to always be alert because some countries may abruptly change their interest rates.
Consumer Spending
Consumer spending (measured by Consumer Price Index) is a very important measure of inflation because it indicates the purchasing power of the consumers.
Inflation is therefore correlated with the purchasing power of a currency against its peers. As stated above, inflation is also tied with the interest rates.
An increase in inflation can therefore lead to the tightening of the monetary policy which leads to increased appetite of the currency.
Therefore, it is very important to look pay a keen interest on the CPI data which is released by the Bureau of Statistics in the USA.
Manufacturing and Service (PMI)
The PMI (Purchasers Managers Index) is an important data because it measures the activities of the purchasing managers. If their activities increase in a given month, it is an indication that the manufacturing and services sectors are doing well.
Every month, the data from most countries is released by Markit (here the latest) and other research firms. As a trader, you should pay close attention at the PMI numbers of countries like China, US, and Germany.
Employment Change
The United States Bureau of Labor releases the employment change data on a monthly basis. This data is important because it highlights the overall health of the economy.
For the US, they are released every first Friday of the month. In these numbers, you should focus on the headline number that shows the number of people who were employed. You should also look at the unemployment rate, participation rate, and productivity rate.
How to read employment changes? If the economy adds more jobs, investors take it as a positive note that the economy is improving.
On the other hand, if the economy sheds jobs, then this is an indication that the economy is not doing well. Investors look at the overall health of the numbers as well as the wages.
As a trader, you should always take note of the day and time when this data will be released and probably avoid the market at this time.
GDP
The GDP (Gross Domestic Product) is the most commonly used data to indicate the health of the entire economy. This data represents the market value of all goods and services in a country during the year.
A growing GDP indicates a strong economy and a reducing GDP shows a weak economy. Investors always want to be engaged in a country that is doing well economically.
Therefore, as a trader, you need to always have a look at the GDP figure and the rate of growth. As a lagging figure, you should look at the advance report and the preliminary report.
Retail Sales
The retail sector is a very important in the financial market. An increase in retail sales is an indicator that the economy is doing well. The data is very important to investors because it measures the overall strength of consumer spending and the effectiveness of the retail stores.
The report is released on a monthly basis and is also an indicator of the performance of lagging indicators such as the GDP.
Housing Data
Housing is so important because of how people from around the world value having a home. As such, most people will always do whatever it can to get a home. Since houses are usually expensive, most people usually take loans.
Therefore, if the housing sector is vibrant, it should be a sign that the economy is doing well. As the housing sector slows down (and prices fall), it is a sign that all is not well.
Investor Activities
Data on investor activities is also very important in the economy. Contrary to the popular belief that the best time to buy is during a bullish run, the fact is that it is always best to buy when everyone is selling.
Related » Is the Bear Market Condition Relevant for Day Traders?
Buying at this time will give you a chance to buy valuable companies and instruments at a very fair price. You can found the data on investor activities in various filings.
Balance of Payments
This is an indicator between the amount of money received from outside countries and the money leaving the country.
In many cases, this represents a balance between the imports, exports, and payment transfers.
A positive trade balance is realized when the amount of money coming exceeds the one that is leaving. This data is available in the economic calendar.
There are many other indicators published by government and private agencies. As a trader, it is very important to be aware of the data, the trend and the best approach to enter, leave or stay in the market.
Tip: Stay out of the market when the data is released to reduce the amount of exposure to volatility.
Political Events
Politics are very important because it is politicians who are tasked with making major fiscal decisions. They make decisions on government spending and many other issues.
Therefore, when there is an election, traders should always pay close attention. In addition, when a major politician makes a major decision, traders should listen.
For example, when Trump says he will exit NAFTA, traders should listen because the president has the powers to exit such trade agreements.
Crude Oil Data
While data on all commodities is released every month, none is usually more important than that of crude oil. This is because of the central role crude oil has on the global economy.
Every month, you will receive data on the crude oil inventories and the production rate by OPEC and other producers. As a trader, you should always look at this indicators and analyze its impacts on the economy.
Related » Why is Crude Oil Price Rising?
Summary
There are other important numbers that have an impact on the stocks and currencies. Some of those we have ot mentioned are home price index (HPI), industrial production, COT reports, and construction numbers.
External useful resources about Economic Indicators
- Here you can find a full list of indication
- Learn more on Admiralmarkets
