As a day trader, your career revolves around making short term trades and taking some quick gains. This can be very profitable for experienced traders and a nightmare for inexperienced traders.
The difference between experienced day traders with the inexperienced ones is that the former have mastered key strategies of trading. Some have expertise in fundamental trading while others are experts in technical analysis. Others are experts in the two methods.
But there are many other ways to distinguish a trader’s approach toward the market. Are you going to follow a trend (this allows you to take advantage of reversals as well)? Are you going to focus on volume? Or do you want to trade only liquid assets?
Let’s try to bring order, and help you answer this question. In this article, We will look at the best technical indicators for day trading.
Characteristics of good indicators for day trading
There are many technical indicators in the market. However, not all of them are ideal for day trading. Some, like accumulation and distribution, Average True Range (ATR), and McClellan Oscillator are not ideal for short term activities on the market.
So how do we choose the best ones for our purpose? Here are some of the top characteristics of the best indicators for day trading.
Have a good reaction time
A good day trading indicator needs to have a good reaction time when applied in a short-term chart. This means that the indicator should work well in timeframes like 1-5 minutes.
Some of the top indicators that fit this criteria are Volume Weighted Average Price (VWAP), moving averages, Bollinger Bands, and Relative Strength Index (RSI).
Related » 1 Minute Scalping Strategies
Simplify complex data
A good day trading indicator is one that simplifies complex data and presents it in an easy-to-understand way.
For example, an indicator like the RSI simplifies a complex data of an asset’s rate of change and presents it in an easy way. It is then easy to understand this data since 70 and 30 are signs of an asset being overbought and oversold, respectively.
Easy to interpret
Most importantly, a good day trading indicator should be easy to interpret. For example, traders who use the VWAP initiate a buy trade when the price moves above the indicator and vice versa.
Similarly, traders who use two moving averages initiate a trade when the two averages make a crossover. Some technical indicators like the Awesome Oscillator and the Accumulation and Distribution are usually hard to interpret.
Can work well when paired with other indicators
Most traders use a combination of two or three indicators. Therefore, you should select an indicator that works well with others.
For example, you can use moving averages in combination with the Relative Strength Index. In this case, the MA will show the trend while the RSI will show whether an asset is overbought or oversold.
Adaptable to your strategy
A good indicator should be adaptable to your strategy. For example, if you are a trend follower, you should focus on trend indicators like moving averages and Bollinger Bands.
If you focus on reversals, you should use good reversal indicators like the Donchian channels and Bollinger Bands (yes, BB is a good tool!).
Most reliable indicators for day traders
Moving Averages
Moving Averages (MA) are some of the most commonly used technical indicators because historically, they have done very well. There are 5 main used types of moving averages which include:
- Simple moving averages
- Exponential moving averages
- Triangle moving averages
- Double exponential moving averages
- Smoothed moving averages
For day traders using the moving averages, the secret is to use a short duration such as 10 days. Exponential Moving Average reacts faster than other types of moving averages. It is also important to combine a shorter term moving average with longer term moving average.
A buy signal comes out when the moving average is below the current price of the asset.
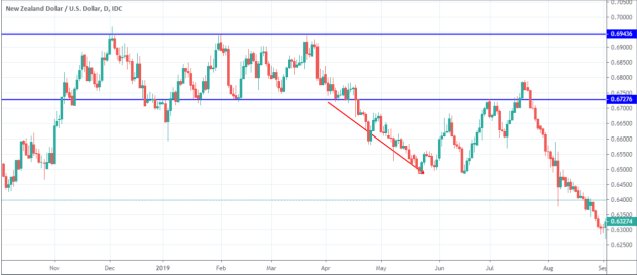
Support and resistance
In investing, a common cliché goes like this: buy low and sell high. This is a fact that if you buy low and sell high, you will make a good profit. However, the challenge comes when identifying the low point to buy and a high point to sell.
In many cases, people, including experienced traders, buy with the impression that the chart has reached the floor only to find the chart continuing a downward trend. It is for this reason that the concept of support and resistance becomes very important.
The figure below shows the concept of support and resistance. The challenge many traders face is on how to identify the support or resistance. A number of ways have been developed which entail using various technical indicators such as moving averages to judge an asset.
The figure below shows a good example of support and resistance in action.
Average Directional Index (ADX)
The Average Directional Index (ADX) is a very important indicator used by traders to identify a trend. The Average Directional Index is derived from the plus directional movement (+) and the minus directional index (-).
The directional movement is positive when the current high price subtracted by the previous high is bigger than the previous low subtracted by the current low.
On the other hand, the directional movement is negative when the previous low subtracted by the current low is bigger than the current high minus the previous high. Understanding these concepts is very important for any trader.
However, since most trading systems are automated, there is no need for manual calculations. In ADX, a value less than 30 indicates a weak trend while a value above 25 indicates a strong trend.
Therefore, if the ADX value is strong, a trader needs to buy at the pullback sections when the pair retreats. The pullback section will act as the support.
Commodity Channel Index
The Commodities Channel Index (CCI) was created by Donald Lampert in 1980. It is one of the best and most common technical indicators used in day trading because of its accuracy.
It is used to identify a trend or warn of extreme conditions by measuring the current price level to an average price over a particular duration of time.
When the prices are above their average, the CCI level is usually high. On the other hand, CCI is low when prices are below their average. Therefore, it is an important indicator for overbought or oversold levels.
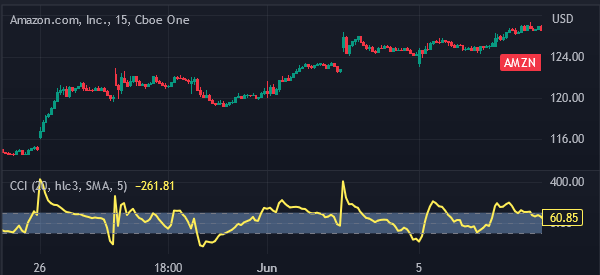
Quite often, most CCI levels happen between -100 and +100. When these extremes are passed, it is usually an extreme situation which calls for caution when placing trades. A positive CCI value favors bulls while a negative CCI favors bears.
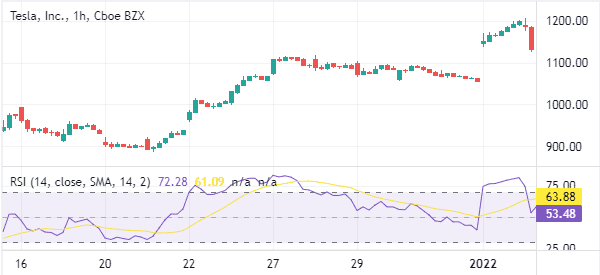
Relative Strength Index
Relative Strength Index (RSI) is an indicator just like CCI that aims to identify overbought and oversold positions. The RSI chart ranges from 0 to 100. When the RSI of a commodity, currency or equity goes above 70, it indicates an overbought position. This overbought position is a good candidate for bears.
On the other hand, if the RSI goes down to 30, it might be an indicator that the asset is being oversold. The figure below shows the RSI index in Tesla Stock and notice what happens in the marked areas.
By combining these indicators, it is possible for a trader to make huge profits. However, it is important to note that they are not accurate all the time. Before a trader implements any technical indicator, it is very important to know more about it and backtest it.
Useful external resources about technical indicators for day trading
- ADX: The Trend Strength Indicator – Investopedia
- How to Trade Using the Commodity Channel Index (CCI) – Tradingsim
