In the past few months, we have been on a journey to help our traders make good decisions in the market. We have done that by showing how our traders trade in Facebook and on YouTube (with a 3 hours daily show).
We have also been writing more about technical indicators and how you can use them in the market. In this report, we will look at the Advance Decline Line (ADL), which is not a very popular indicator in the market.
What is the Advance Decline Line Indicator?
The Advance Decline Indicator, also known as the AD Line (or ADL) is an indicator used in the stock market. The indicator is based on the idea of net advances, which is a concept of looking at the number of stocks that are positive for the day minus those that are negative in the day.
As a result, the AD line will be positive when the stocks that are gaining are positive. The line is negative when most stocks being analysed are negative.
Best Practice
Because of how it is structured, the ADL indicator is mostly useful when you are trading the main indexes like the Dow Jones Industrial Average, S&P 500, and the DAX.
This is simply because these indexes are made up of an exact number of stocks. The Dow has 30 while the S&P 500 has 500 companies.
When applied on a chart, the Advance Line Indicator appears as a line that is similar to the accumulation and distribution line that we covered a while back.
How is it Calculated?
The AD line is calculated by looking at the stocks that are gaining today and subtracting the previous day’s AD. This formula is shown below:
| ADL = (Today’s gaining stocks – Today’s lagging stocks) + yesterday’s AD line value |
You can also factor in the volume of these stocks by using the formula below:
| ADL = (Today’s advance volume – Today’s declining volume) + yesterday’s ADL volume |
Therefore, the process of calculating the indicator is relatively long. Still, as we have written before, you should only focus on how to apply it on a chart and how to interpret it.
Another thing. If you have to calculate the indicator, we recommend that you do it after the market has closed. This will give you a more accurate result because stocks are constantly moving during the day.
» Related: Strategies to trade the close
How do you Use the Advance Decline Line Indicator?
First, we recommend using the indicator when analysing indexes like the Dow Jones and the S&P 500.
Second, you should use the indicator in combination with other indicators and chart patterns like the cup and handle pattern, Doji, and the Elliot Wave. This is particularly important because this indicator will not tell you where to buy or sell. Instead, it will give you an indication of how the index is moving.
Third, you should use the Advance Line Indicator when the chart of an indicator is trending.
» Related: The best trend indicators
A Practical Example
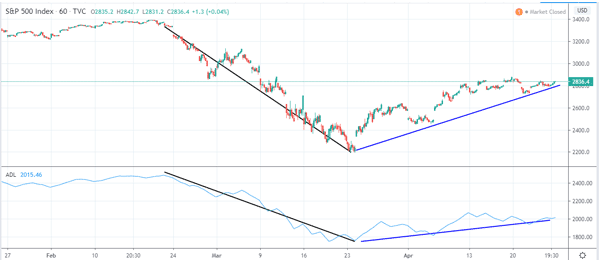
The chart below shows the three-month chart of the S&P 500 index. As you can see, the ADL line moves downwards when the index is falling.
This is because, in this situation, the number of lagging stocks is usually more than the gainers. Also, as shown in the blue lines, the index rose when the indicators are rising.
Still, as you can see, the indicator does not tell you whether to buy or sell the index.
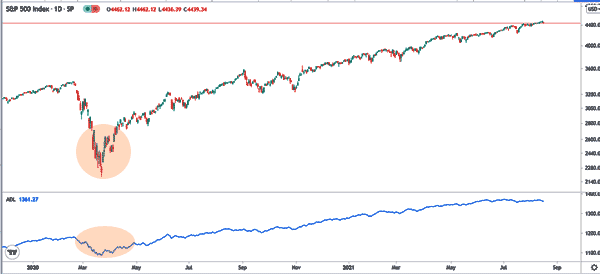
ADL for the S&P 500
The chart below shows the ADL for the S&P 500 index. This chart shows that the indicator declined sharply when the Covid pandemic was announced in 2020. This happened as the number of falling stocks and their volume in the S&P 500 index rose.
» Related: The importance of volume for a trader
Shortly afterwards, the indicator rallied as more stocks and their volume soared.
ADL vs TRIN
The Advance Decline Line (ADL) and the Arms Index (TRIN) are based on the same concept. In other words, they both want to look at the number of companies that are rising and those that are falling in an index like the S&P 500 and DAX index. The chart below shows the TRIN and ADL applied in a chart.
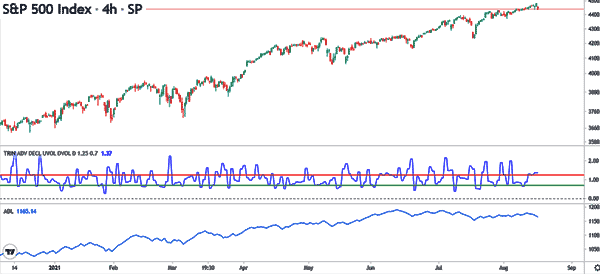
The difference between the ADL and TRIN indicator is that the latter one compares the number of rising and declining stocks with that of the declining and rising volume.
The TRIN indicator has three readings, including at, below, or above. A move above 1 is usually a sign that there are more advancing stocks and volume and is a bullish thing for the index. A decline shows that there are more sellers in the market.
Pros and cons of ADL
The ADL line has several pros and cons. The first benefit is that it gives you an indication of the market conditions in the stock market. Second, it is a good breadth indicator that includes both the number of advancing and falling stocks and their volumes.
On the other hand, the cons of the indicator are that it is mostly useful when you are trading indices. Also, unlike other indicators, it does not give a clear picture of what will happen in the future.
Final Thoughts
The Advance Line Indicator is not very popular for a reason: unlike other indicators like the Relative Strength Index (RSI), the indicator does not tell you when to buy or sell an asset.
In fact, in a period when the asset has been trending for a long time, the indicator is just a long line. Therefore, we recommend that you use the ADL sparingly.
External Useful Resources
- What The New High In The Advance-Decline Line Means For Stocks – Advisorperspectives
- More about the ADL in Charts – StockCharts
