Andrews pitchfork is an important technical analysis tool that helps traders and investors identify potential support and resistance levels. The tool was developed by Alan Andrews, a statistician, and trader.
Today, the tool is provided for free by all trading tools like the TradingView and the MetaTrader. In this article, we will look at what the Andrews Pitchfork is and how you can use it well.
What is the Andrews Pitchfork?
As mentioned, the Andrews Pitchfork is a tool used to identify support and resistance levels. For starters, a support is often viewed as a floor where the price struggles to move below. A resistance, on the other hand, is seen as a ceiling where it struggles to move above.
The two are usually the most important levels in the financial market because they are where the price tends to reverse or continue.
The pitchfork is made up of three primary lines. It has a median line, which is usually at the center. It is then surrounded by an upper and a lower equidistant lines. Therefore, It is possible to add more parallel lines below and above the first support and resistance lines.
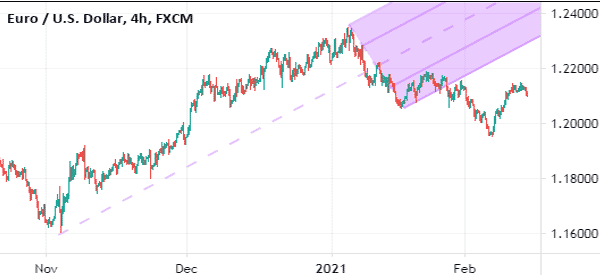
The chart below shows the EUR/USD with the Andrews Pitchfork added in it.
Key parts of Andrew’s pitchfork
As mentioned, the Andrews pitchfork tool has three important parts. First, it has the median line, which is often the reference point, as I will highlight below.
Second, the tool has support levels. A support is defined as a floor where a financial asset struggles to move below. In most cases, a break below the support level is usually a sign that bears are prevailing and that the price will continue falling. The typical Andrews Pitchfork is made up of two support lines.
Third, Andrews pitchfork has a resistance point. The resistance point is often seen as a ceiling where an asset struggles to move above. A bullish breakout is confirmed when the price moves above the resistance point.
How to draw the Pitchfork Indicator
Like other technical tools, drawing the Pitchfork lines is relatively easy.
First, you must look at a chart visually and see whether the pitchfork is ideal. For that to happen, the chart needs to have important low (1) and high points (2). It also needs to have another third point, as shown above. The second and third points will always define the width of the pitchfork.
Second, select the Andrews Pitchfork tool on the trading platform. On the TradingView tool, the pitchfork is located on the left side, as shown below. The dotted line in the middle is the median line while all lines below it are the supports. The lines above it are the resistance levels.
The median line theory
The median line of the Andrews pitchfork tool is an important part that provides a lot of information to both the trader or investor. The line simply gives the reference level of where the price of an asset is.
For example, if an asset drops below the median line, it is a sign that it will then continue to the first support. Similarly, if the price rises above that median line, it is a sign that it is gaining momentum.
There are other ways to use that median line. For example, if you have a bullish trade, then, you can set a take-profit at the median line. Similarly, if you have a bearish trade, then you can use it as the exit point.
Identifying the pitchfork
Finally, with the tool selected, point to the first level and then move it to the second and third levels. After doing this, you can change the colors for easier identification.
It is worth noting that while the pitchfork can be used across assets, it cannot be used in all types of charts. For example, it cannot be used when the chart is ranging or when the chart is moving horizontally.
How to use the Andrews Pitchfork
Using the pitchfork once you have added it to a chart is a relatively easy thing to do. You only need to identify the levels and anticipate the next move.
Use levels as entry points
First, you can use the levels as entry points. For example, you can use the four lines as points of entry. If the price moves above the median line, you can view that as an important buying point. On the other hand, if it moves below the median line, you can see it as a vital selling point.
Trend confirmation
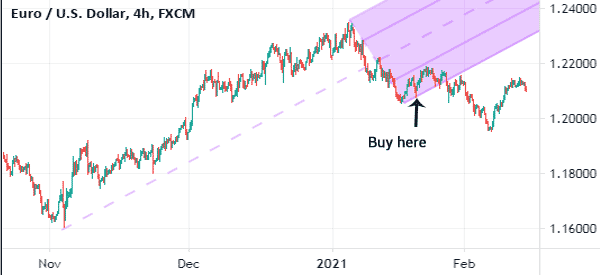
Second, you can use the pitchfork as a trend confirmation level. For example, in the chart below, we see that the EUR/USD has started moving up above the second support level. Therefore, if you are long the pair, you should look at the first support carefully.
If the price moves above this level, it will send a signal that there are enough bulls in the market. The next level to watch will be the median. If it passes above this price, then the next target will be the first resistance and so on.
Shorting
You can also use the pitchfork when shorting an asset. For example, if you short at the second resistance, you can watch the first resistance to be your profit target. Later on, you can check the median line and so forth.
Use the Andrews pitchfork to find support and resistance
One of the most important uses of the Andrews pitchfork tool is to identify support and resistance levels. After placing the pitchfork on a chart, you will often find the price struggling to move below or above certain levels.
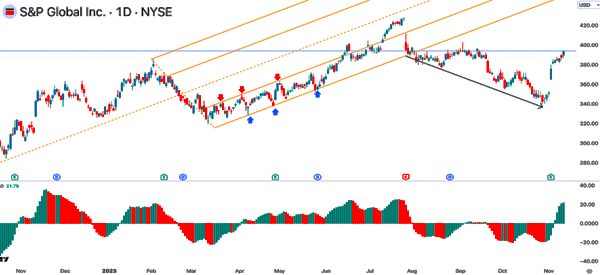
Depending on where these levels are, these prices are the S&R points. A good example of this is in the chart below.
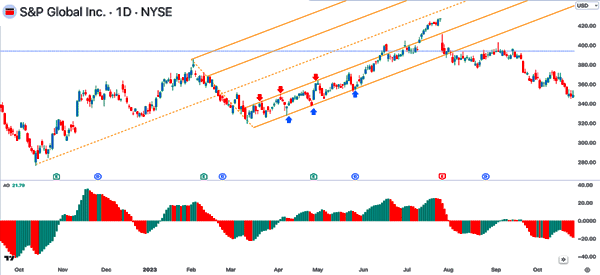
As you can see, we have placed Andrew’s pitchfork tool on the S&P Global chart. As the stock rose, it formed strong support and resistance levels, which are shown in blue and red, respectively.
Therefore, in this case, if the price moves below the lower side of the pitchfork, it can be seen as a confirmation of the bearish breakout. This breakout will then lead to more downside.
Combine with Fibonacci retracement
Fourth, you can use the pitchfork by combining it with other tools. The most common one you can use in this is the Fibonacci retracement. As we have written before, the retracement identifies areas of potential reversals.
Therefore, if you draw the two tools, you can easily see potential buying or selling levels. The chart below shows the two tools drawn in a chart.
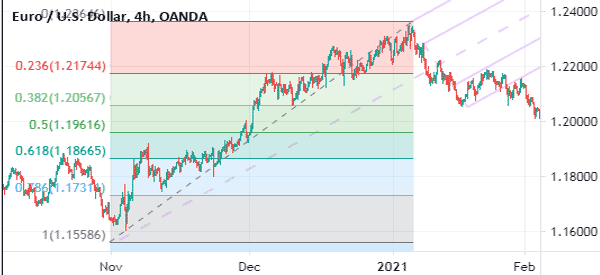
In the chart above, we see that the second part of the Andrews pitchfork lines-up well with the 38.2% Fibonacci retracement. Also, the second line is at the same level as the 23.6% retracement. Therefore, if the price moves above the 23.6% retracement and the first support, it could be a good place to enter a buy trade.
Buying and selling opportunities with Andrew Pitchfork
A common question among traders and investors is when buying and selling opportunities come in. There are several levels to watch.
First, if the price moves below the lower side of the pitchfork, it is a sign that the bearish trend will continue. This makes it a good time to place a short trade. A good example of this is shown in the chart below.
Second, if the price moves above the upper side of the pitchfork, it is a sign that the asset has momentum. As a result, it makes sense to buy if this breakout happens.
Third, the other buying and selling opportunity is when the asset moves above or below the median line. If it moves above the median line when it is going upwards, it is a sign that the price will continue rising. Similarly, if the price drops below the median line, it is a sign to short the financial asset.
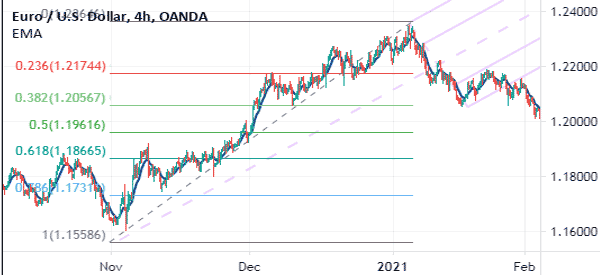
Combine with other technical indicators
Most importantly, you can combine the Andrews pitchfork with technical indicators like the moving average and the RSI. For example, in the chart below, we have combined the pitchfork, Fibonacci, and a 25-day exponential moving average.
In this case, the pair will maintain a bullish trend so long as it is above the moving average. If it moves below, it may be a signal to exit.
Use pending orders
Finally, it is worth noting that you can use the pitchfork well using pending orders. For example, in the final example above, you can place a buy stop pattern above the first support and have a stop loss at the median line.
In this case, if the price moves above the support level, the stop trade will be initiated. It will then be stopped when the price reaches the median point,
Similarly, you can have a sell stop trade below the second support level. Therefore, if the price breaks below the lower line, the trade will be initiated.
Andrew Pitchfork trading strategies
There are also several trading strategies when using the pitchfork tool. We have looked at some of these strategies to some extent.
First, you can trade within the Andrews pitchfork channel. There are four key channels in the tool. In the S&P Global chart above, we have put the blue and red arrows in the first channel.
The second channel is between the first support and median line. In this case, you can place a buy trade when it retests the lower side and exit when it hits the first support.
Second, you can trade when the price finally breaks above or below the Andrew’s pitchfork tool. As mentioned above, a break above the upper side of the tool is a sign that the price will continue rising. Similarly, if the price moves below the pitchfork, it is a sign that the price will continue falling.
Last, but not least, there is trend-following. This is where a trader buys when it retests the lower side of the pitchfork and then holds the trade as it continues rising. The thesis is that the asset will continue rising until it retests the upper side of the channel.
Further, there is the aspect of trading outside Andrew’s pitchfork. This is an approach where you follow the trend when it breaks above or below the pitchfork tool.
Mistakes to avoid when using the pitchfork tool
As with the other tools, there are several mistakes you need to avoid when using the Andrews Pitchfork tool.
First, avoid entering the trade so soon after it reaches a crucial level. For example, avoid buying it as soon as it moves above a certain level such as the middle line. We recommend that you be patient and wait for the trend confirmation.
Second, don’t use the pitchfork tool alone. Instead, you should always use it together with both technical indicators and chart patterns. Some of the most popular chart patterns to consider are the head and shoulders, double-top, and rising wedge.
Further, you should avoid using the pitchfork together with so many tools. Some traders combine it with tens of indicators and tools like Fibonacci and Gann. Doing this will often confuse you.
Summary
The Andrews pitchfork is an important technical indicator in the market. Traders have used it for decades to identify support and resistance levels and points of reversals. You can experiment using the tool using a demo account.
External useful reosurces
- Andrew’s Pitchfork: 3 Steps Traders Take To Use This Analysis Tool – Commodity
