As a trader, having a good understanding of technical analysis is mandatory. This is simply because you will use technical indicators to predict the price action of the financial asset.
In the past few months, we have been covering various aspects of technical indicators. We have looked at indicators ranging from simple moving averages to complex Keltner channels.
Today, we will look at the Aroon indicator and how you can use it in the financial market.
What is the Aroon Indicator?
The Aroon is an indicator that determines whether a financial asset is trending or not and how strong the trend is.
The indicator was developed by Tushar Chande in 1995 (as other tools like the Chande Momentum Oscillator, or CMO). Chande named the indicator Aroon because it means dawn’s early light in Sankrit.
The indicator is not very popular in the financial market. As such, you will not find it installed by default in the MetaTrader. You will need to install it yourself. After installing it, you will see it have two lines of different colours.
These lines are known as Aroon-Up and Aroon-Down. An example of Aroon indicator is shown below. In this example, Aroon up is shown in red while Aroon-down is shown in purple.
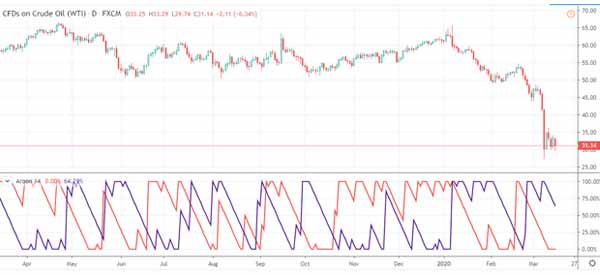
For example, an Aroon indicator with a period of 25 measures the number of days that an asset had up days and down days in that period. As such, the indicator is relatively different from other oscillators since it does not focus on volume.
There are primary three uses of the indicator, including identifying new trends, consolidations, and corrections.
How do you calculate it?
The Aroon indicator is usually shown in form of a percentage. The range of this percentage is between 0 and 100. The two lines are calculated in a simple process.
Aroon up is calculated as shown below:
| Aroon-up = ((25 – days since 25-day high) / 25) x 100 |
It is calculated like this because Aroon Up measures the number of days since a 25-day high.
The other line – Aroon-down – is calculated using the following formula:
| Aroon-down = ((25 – days since 25-day low) / 25) x 100 |
The default period when calculating the Aroon is 25. However, as we have mentioned before, you can change these periods depending on your trading strategy.
Also, as you can see in the example above, Aroon usually declines as the elapsed time between a high and a low increase.
Day Trade with the Aroon Indicator
How to Interpret it
Like all oscillators, interpreting the Aroon is a relatively simple process. The most important part of doing this interpretation is the colours of the bands.
The next one is to look at the percentage levels, which range from 0% to 100%. The price also tends to oscillate above and below the centreline, which is usually 50.
In most cases, bullish signals usually emerge when the Aroon Up indicator is above the 50% mark. Similarly, bears have an edge when the Aroon down moves below 50%.
Another signal in Aroon happens when the indicator moves above 100. In this case, it means that a new trend is emerging. This is because it means that prices are constantly hitting new highs or lows.
Traders look for three stages to identify a new trend signal:
- They look at a time when Aroon up moves above Aroon-down.
- The second stage happens when Aroon-Up moves above 50 while Aroon-down is moving below 50.
- The final stage is when Aroon-Up rises and reaches 100 while Aroon is at low levels.
Another thing traders look is consolidation. Consolidation happens when Aroon-up and Aroon-down are moving downwards with parallel lines.
Readings below 50 are usually a sign that consolidation is taking place.
Best settings for the Aroon indicator
There are only two settings of the Aroon indicator. First, you can set the colours of the indicator. By default, it comes with the orange and blue colour. Orange is for the up days while blue is for down days.
Second, you could change the reference period. By default, the period is usually 14 but you can tweak it to match your strategy.
How to Use it in Charts
The first step for using the Aroon indicator is to select the currency pair, commodity, or any other asset that you want to use. If your trading platform has Aroon as a built-in, you should select it. However, if it is not, you should move ahead, download it, and install it.
You should then select the indicator and apply it. You will notice that there is no horizontal line that is drawn at the 50% level. Use the lines tool and draw it.
You should also look at the input period and ensure that it is in line with your strategy. Mostly, you should use 25 as the default period. Using a very small period will make the indicator difficult to interpret.
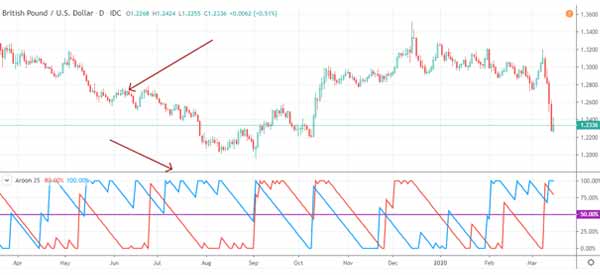
As shown below, as GBP/USD pair was declining, the Aroon-down line was along the 100% level while Aroon-Up was moving lower. Similarly, as the price was moving upwards, the Aroon-up was at 0% while Aroon-down was moving downwards.
As with other indicators, Aroon is best used in combination with other indicators like the RSI and the commodities channel index.
Summary
Aroon is not a common indicator. In fact, very few retail traders use it. Still, the indicator has been used successfully by most Wall Street traders (as a part of their strategy).
As a trader, we recommend that you read more about it and then do a lot of experimentation to see how it fits within your trading strategy.
External Useful Resources
- How to use Aroon Indicator for mastering market timing – Moneycontrol.com
- Momentum Trading Strategies with the Aroon Indicator – Forexop
