ATR is commonly used to show volatility, one of the most important concepts in the financial market. Volatility it is loved and hated in equal measure by traders. There are some who specialize in making money when the markets are volatile (our guide about this) and others who love it in a period of low volatility.
There are several ways of seeing whether a market is volatile or not:
➤ First, you can observe the market visually to see your preferred assets are trading.
➤ Second, Wall Street traders observe the CBOE volatility index (VIX). This is one of the most commonly-used tools.
➤ Third, you can use the many volatility-based indicators to measure volatility.
In this article, as we said just above, we will look at one of them: the Average True Range (ATR).
»How to Trade Stock Volatility?«
What is the Average True Range?
The Average True Range (ATR) is one of the many indicators that was developed by Alexander Wilder. He first wrote about the indicator in his book, New Concepts in Technical Trading Systems. Other indicators that he suggested were the Relative Strength Index (RSI), Parabolic SAR, and the Directional Movement index.
These indicators were developed with commodities being in mind (Wilder was known for being a successful trader in corn and energies). Commodities are also known to be more volatile than stocks. Therefore, this volatility leads to significant gaps and limit moves.
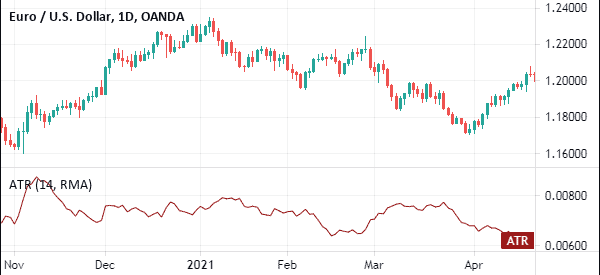
The chart below shows how the ATR looks like when added in a chart. A high ATR figure is a sign of high volatility while when it is falling, it signals reduced volatility.
ATR Formula
The Average True Range is calculated using a very simple formula:
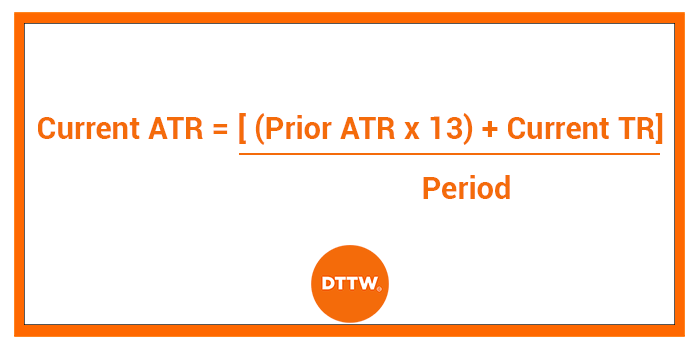
The most commonly used period is 14.
As with most indicators, it is not mandatory that you know how they are derived. What you need are three things:
- How to apply them on a chart
- Change the period to suit your trading strategy
- How to interpret the indicator
What is average true range used for?
Volatility is an important concept in the financial market. It simply refers to the degree of movement of financial assets within a certain period of time. For example, assets like Bitcoin and Ether are more volatile because their prices can rise and drop by more than 5% within a session. On the other hand, some stocks like Berkshire Hathaway are not volatile since they don’t move significantly in a session.
Long-term investors make most of their money when a stock is rising slowly over a long period of time. As such, they are not fond of volatility. On the other hand, day traders love volatility because of the significant opportunities it creates.
A good example is what happened during the coronavirus pandemic in 2020. Since there was a lot of volatility, many investment banks and hedge funds that have large trading accounts generated billions of dollars.
Therefore, the Average True Range (ATR) can tell you whether there is volatility or not. Other indicators that show or measure volatility are Bollinger Bands, historic volatility, Donchian channels, and the relative volatility index.
How to Read (and use) the ATR
The ATR is an indicator that is significantly different from other indicators we have covered. This is because it is not used entirely to predict where the asset is moving. It is also not used to show whether an asset is overbought or oversold.
Instead, it is used to show whether there is volatility in the market or not.
So, how do you use the Average True Range?
When the market is consolidating, the ATR usually shows no major moves. This is because there is no volatility. If the price breaks out and starts moving lower, you can use the ATR to validate whether there is enthusiasm in the market about it.
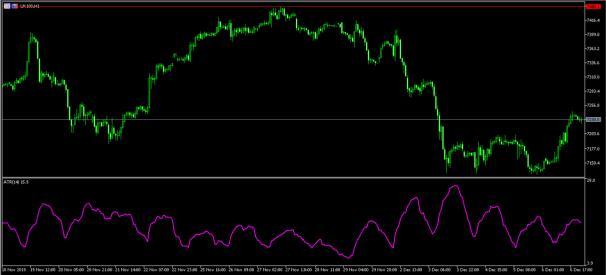
A good example of the Average True Range indicator at work is shown in the UK100 chart above.
As you can see, the indicator showed little movements when the index was in consolidating. It started moving higher when the index started to decline. This is an indication that there was enthusiasm about the new downward trend.
Therefore, the key point to the ATR is that is that it is not an indicator that tells you directly what to buy or sell. As such, you should aim to combine it with other indicators like the moving averages and the RSI.
ATR Trading Strategy – calm before a storm
Another way of interpreting the Average True Range is to view it as the calm before the storm. This simply means that when the ATR is at a relatively low level, it means that there is not much volatility in the asset. As such, this is usually a sign that the price will have a breakout in the near term.
A good way to trade this is to combine it with other price action features. For example, if the ATR declines during a bullish flag, it is a sign that the price is about to have a bullish breakout, and vice versa.
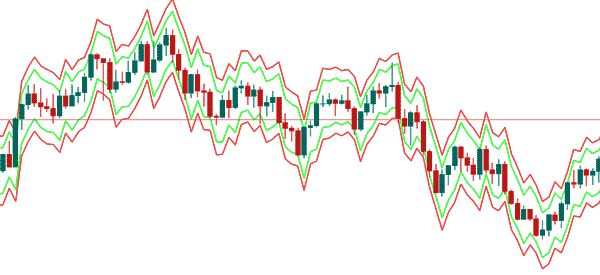
Average True Range Bands
The ATR bands are derived from the ATR and are not found in most trading platforms. You can find them in TradingView though. Not much is known about them though. When applied to a chart, the ATR bands are four bands that surround a financial asset. The default colors are red and green while the default period is usually 14. The ATR profit multiplier is 1 while the stoploss multiplier is 1.5.
The chart below shows the ATR bands applied on the EUR/USD chart.
External useful resources
- How to Read and Apply the ATR Indicator for Stock Trading – Speedtrader
