The awesome oscillator is a leading indicator that was developed by Bill Williams. Bill has also developed other popular indicators like the alligator, fractals, and the accelerator oscillator.
In this report, we will look at what the awesome indicator is, how it is calculated, and how you can use it in the financial market.
What is the awesome oscillator?
The awesome oscillator is an indicator that works by comparing the recent movements in an asset with the historic trends. Like all oscillators, it works by having a centreline or the neutral line and other lines.
Therefore, as you will see below, this centreline is usually the most important when using the indicator.
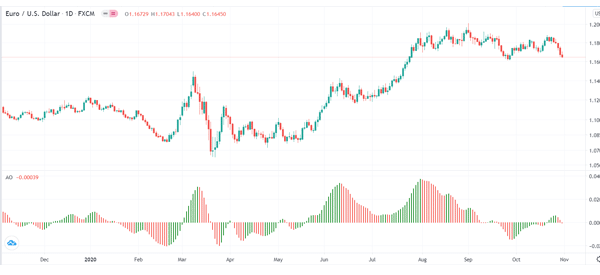
Ideally, when the line is above the zero line, it is usually a sign that the price is bullish. Similarly, when the line is below the neutral line, it is usually a bearish sign. However, as with all indicators we have looked at before, there is no guarantee that the price will start rising immediately the oscillator moves above zero.
The chart below shows the awesome oscillator applied in the daily chart of the EUR/USD pair.
How the awesome oscillator is calculated
The awesome calculation is a relatively easy to calculate indicator. The formula of calculating the indicator is:
| Midpoint value = (High + Low) / 2 |
| Awesome oscillator = Simple moving average (median price, 5) – SMA (median price, 34) |
In other words, the awesome oscillator indicator is the difference between the 5-period simple moving average and the 34-period moving average. Instead of using the closing prices, the indicator uses the median value.
How to read the Awesome Oscillator
It is relatively easy to read the awesome oscillator. As shown above, the indicator is made up of two key parts. First, there is the neutral line at zero. Second, there are the green and red bars.
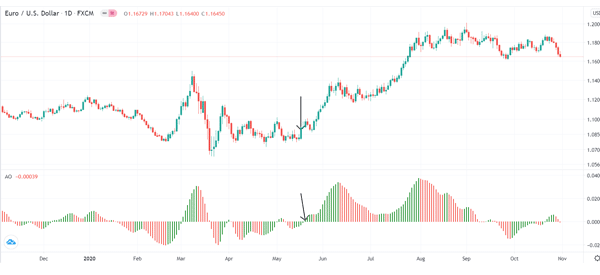
Therefore, a bullish view emerges when the bars turn green below the neutral line and is then confirmed when it rises above the neutral point.
In most cases, you should place a buy trade when the indicator is moving in an upward trend and vice versa.
Related » Best practices and caveats of oscillators
Differences with MACD
Indeed, the indicator is relatively similar to the moving average convergence divergence (MACD). The only difference is that the MACD uses the 12-day EMA – the 26-day EMA. Its signal line is usually the 9-day exponential moving average of the MACD line.
Still, as we have written before, it is usually not necessary to understand how the indicator is calculated. Instead, you should just know how to interpret it in the market.
How to use the awesome oscillator
Using the awesome oscillator is a relatively easy process since it is usually available in most trading platforms like the MetaTrader and TradingView.
Look at the neutral line
As mentioned above, the first approach of using the indicator is to look at the neutral line. In most cases, a bullish signal is usually sent when the awesome oscillator moves from the bottom and crosses the neutral line.
Similarly, a bearish signal usually emerge when the oscillator moves from the upper side and crosses the neutral line as shown below.
Focus on histogram
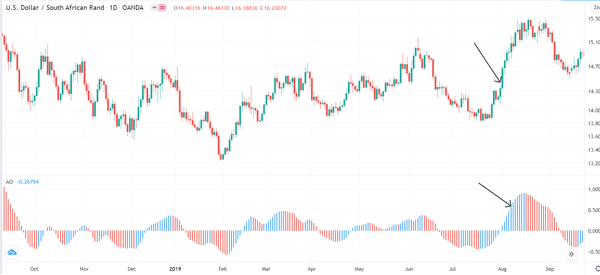
Another approach of using this indicator is to buy when the histogram is below the neutral line but when the green lines move simultaneously while going up. This is usually a sign that bulls are gaining control after the price got oversold.
Similarly, you should short once the red lines start falling the oscillator reaches a high point. A good example of this is shown in the USD/ZAR pair below.
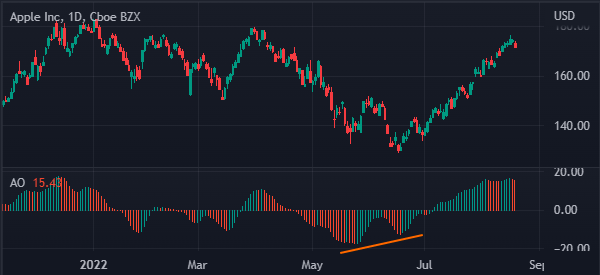
Twin peaks strategy
Another strategy you can use the awesome oscillator with is known as the twin peaks strategy. It is a strategy that involves looking at peaks above and below the indicator.
A bullish twin peak happens when there are two consecutive peaks below the neutral line. In this case, the second peak should be higher than the initial one. A good example of this is shown in the chart below.
A bearish twin peak, on the other hand, happens when there are two straight peaks above the neutral line. The second peak should be below the neutral line. When this happens, it increases the possibility that the asset will start a bearish trend.
Saucer strategy
Another Awesome Oscillator trading strategy is known as the saucer approach. In it, traders attempt to identify three consecutive bars on the histogram to identify signals.
A bullish pattern emerges when there are two straight red bars with the second one being lower than the initial one. The third bar must be green in color.
On the other hand, a bearish sign is seen when there are two straight green bars where the second one is lower than the initial one. In most cases, this strategy is usually not all that accurate.
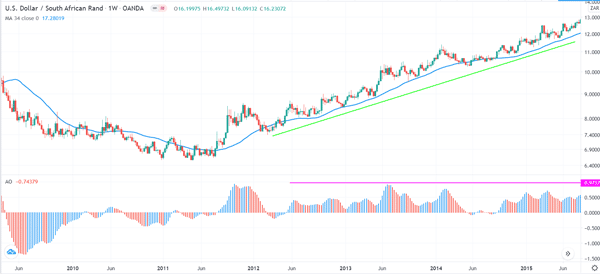
Combine with other indicators
Finally, you can also use the awesome oscillator in combination with other indicators. For example, when following a trend, you can combine oscillator with the moving average to identify when a reversal is about to happen. A good example is in the chart below.
As you can see, as the USD/ZAR pair has been in a strong upward trend. At the time, the oscillation was above the neutral line while the price was also above the 34-day simple moving average.
Final thoughts
The awesome oscillator, like all oscillators by Bill Williams, is an excellent trading indicator that can be learnt within a short period. The process of calculating and using it is relatively easy.
However, like all indicators, we recommend that you take time and learn more about how it works and then you test it in a demo account.
External useful Resources
- Top 4 Awesome Oscillator Day Trading Strategies – Tradingsim
- How to Use Awesome Oscillator Indicator in Forex Trading – Thinkmarkets
