Candlestick analysis is one of the most important concepts in price action analysis. The goal of the procedure is to look at how a chart looks and then using this information to predict how the price will move in the future.
We just looked at how the cup and handle pattern, which is an important component of candlestick analysis works. In this report, we will look at the bearish pennant pattern and how you can use it in the market.
What is the Bearish Pennant?
The term bearish pennant is made up of two parts. Bearish refers to when the price of an asset is moving downwards. It is simply the opposite of being bullish. On the other hand, the term pennant refers to a flag or banner that is longer than the hoist.
In trading, when the price of an asset drops sharply, there are usually two things in play: It usually means that sellers are prevailing while buyers are losing.
However, in most times, a bearish trend is usually interrupted by a few periods of bullishness. This happens when buyers start coming in as some sellers start taking profit. As this happens, it tends to form a pattern, which is known as a bearish pennant.
A bearish pennant is part of the so-called continuation patterns. A continuation pattern is usually a sign that a currency pair, stock, or any asset will continue moving in the original trend. Other examples of continuation patterns are ascending and descending triangles and bullish and bearish flags.
How the pattern is built
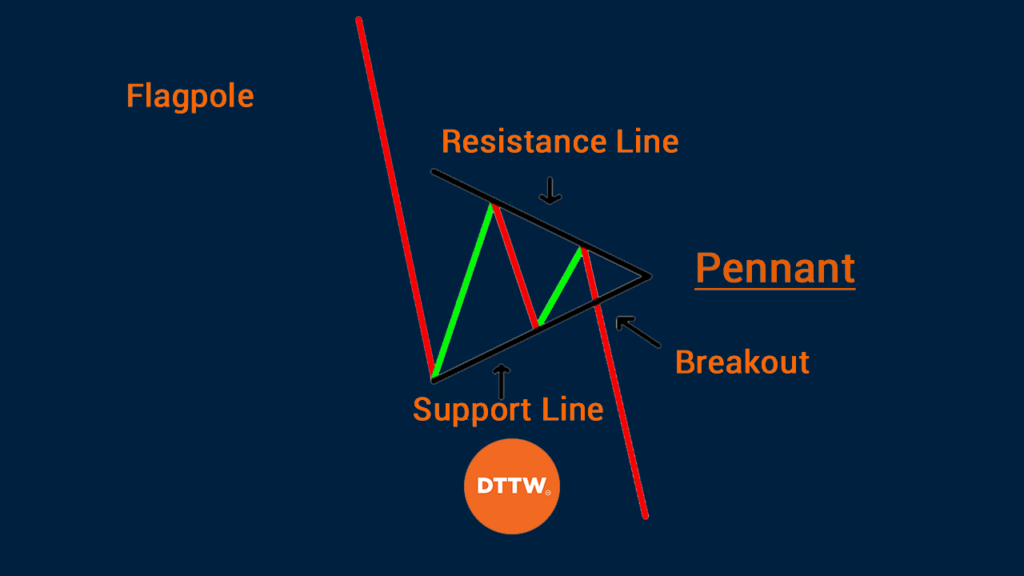
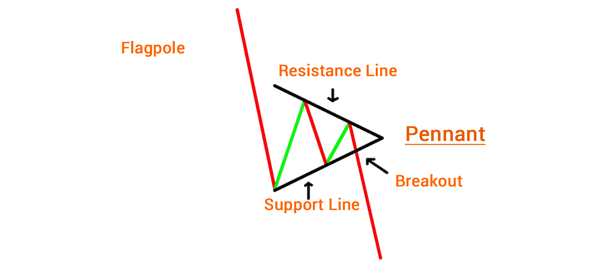
There are three main parts of a bearish pennant. First, there is a flag pole. A flag pole is a long, and often straight line, that happens when the price of an asset declines sharply. It is this flag pole that separate the bearish pennant with other patterns.
The second part is the breakout level. This is a level where the price suddenly moves in continuation of a trend.
Finally, there is a pennant itself. This is simply a small triangle pattern. This triangle usually happens when bulls and bears battle about the movement of an asset. As they battle, the price tends to consolidate between several levels.
The chart below shows how a bearish pennant looks like.
How to Spot a Bearish pennant
A common question is how to spot or identify a bearish pennant pattern. As mentioned above, the process is actually very simple:
- You need to first spot the price of an asset drop sharply
- See the movements that follow
- Connect the upper and lower swings
If it forms a triangle, then you have a bearish pennant pattern.
Please note: It is worth noting that there is another pattern known as bearish flag. This one does not form a triangle. Instead, it happens as an ascending equidistance channel.
Bearish pennant vs bearish flag
A bearish pennant is a pattern that is similar to a bearish flag. The only difference between a pennant and a flag is the fact that the flag is shaped like a rectangle while a pennant has a triangle shape.
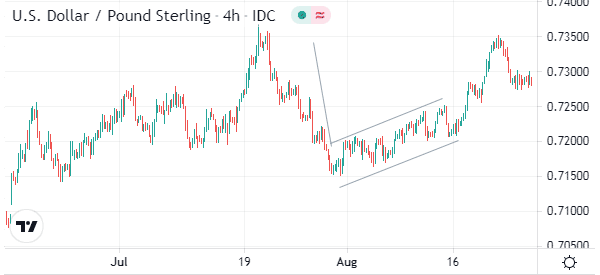
A bearish flag forms after a financial asset forms a major dip. Shortly afterwards, the asset forms a consolidation pattern that resembles a triangle. It has a support and resistance level.
In most cases, a bearish flag pattern will likely breakout lower while a bullish flag will often break out higher. The chart below shows an example of a bearish flag pattern on the USD/GBP pair.
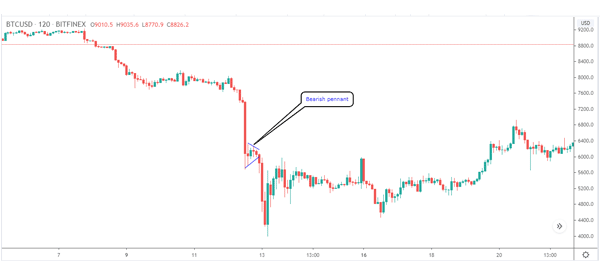
Practical Example
A good example of this pattern is shown on the chart below. As you can see, the price of Bitcoin formed a sharp descent as bears took control. As the price declined, bulls started to come in, which led to a small triangle pattern.
This pattern is the bearish pennant and it was followed by a continuation.
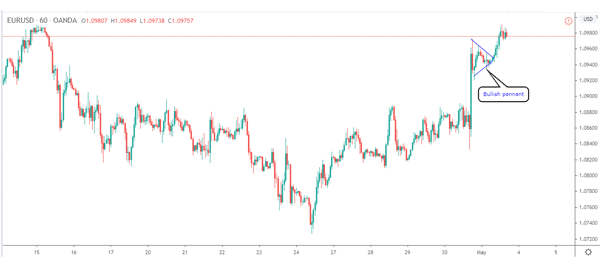
What about a bullish pennant?
A bullish pennant is the exact opposite of a bearish pennant. It happens when a sharp increase in price is followed by a similar consolidation as shown above. A good example of this bullish pennant pattern is shown on the EUR/USD pair below.
Strategies for pennants
Therefore, the strategies of trading the bearish flag and pennants is almost the same. The most ideal approach is to use pending orders to anticipate a breakout.
In a bearish pennant or flag patterns, you should place a sell-stop trade slightly below the lower side of the pattern. In this case, if there is indeed a bearish breakout pattern, the stop trade will be triggered. The initial take profit should be at the lower side of the pennant hoist.
Similarly, in a bullish pennant, you should place a buy-stop slightly above the upper side of the pattern. You should also place a take-profit at the lower side of the flag post.
Symmetrical triangles vs pennants
As mentioned, a pennant pattern has a triangular pattern. Therefore, there is often confusion about it and pennants. In most cases, the pennants often looks like a symmetrical triangle.
The main difference is that the pennant happens after a major bullish or bearish spike. A symmetrical triangle can happen at any point.
Another difference between the two is that the bearish pennant is a continuation pattern. A symmetrical triangle, on the other hand, does not have a defined outlook. In other words, the price can break out in either direction.
Final Thoughts
Bearish and bullish pennants are rare but are very effective when you are trading. They are easy to spot and often very accurate. Also, they don’t require integration with technical indicators like moving averages and RSI.
We recommend that you spend a lot of time practicing and learning about this pattern before you use it.
External Useful Resources
- Differences between a Symmetrical Triangles and Pennant Patterns – Investopedia
