Candlestick patterns play an important part in chart analysis. They refer to the process of looking at a chart and using its pattern to determine whether it will rise or fall.
There are many candlestick patterns that you can use in this analysis like doji, hammer, and morning star. In this article, we will focus on a candlestick pattern known as the belt hold line.
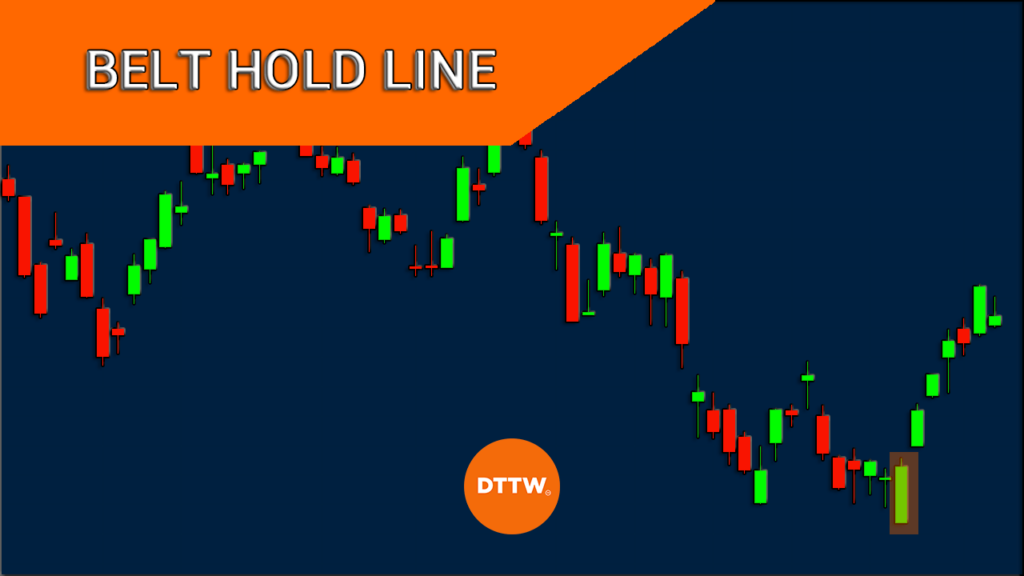
What is the belt hold line?
The belt hold line is a candlestick that can either be bullish or bearish depending on where it forms. When it forms during a downtrend, the candlestick pattern is usually a sign that a reversal is about to happen.
For example, if it happens during a downtrend, it is usually a sign that a new bullish trend is about to form. On the other hand, when it happens during an uptrend, it is usually a sign that a new bearish trend is about to happen.
The belt hold line is similar to a Marubozu, which is usually a candlestick without an upper or lower shadow. Such a candle simply means that the asset opening and closing prices were the highest and lowest points.
In some cases, however, the belt hold line candlestick can have a small upper or lower shadow.
Related » What Is Trend Trading?
Bullish belt hold line
A bullish belt hold line is a chart pattern that happens when an asset is in a downtrend. After dropping for some time, the asset forms a candlestick with a big body and no upper and lower shadows.
In some cases, the candlestick can have a small upper shadow. The bullish belt hold line is known as yokiriri in Japanese.
When it happens, it sends a signal that the bearish trend is about to end and that a new bullish trend is about to happen.
Related » How to Identify the End of a Trend?
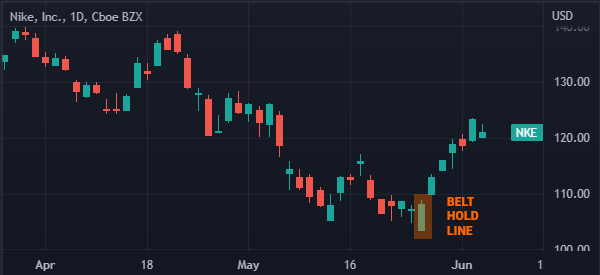
As such, it is a reversal pattern that can tell a trader to execute a bullish trade. The chart below shows how the bullish belt hold line looks like. A good example of this pattern is shown in the Nike stock below.
Bearish belt hold line
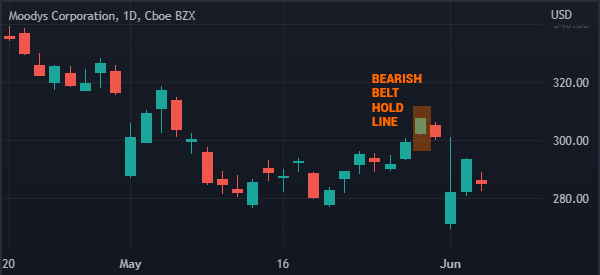
A bearish belt hold line is a chart pattern that signals that a new bearish trend is about to happen. It happens on the top of a bullish trend.
Like the bullish belt hold line, the pattern is characterized by a large body with a small shadow or without one. The chart below shows how the bearish belt hold line looks like.
How to spot the belt hold line
Identifying the belt hold line is a relatively easy thing to do as you can see above. For the bullish belt hold line pattern, the chart needs to first be in a bearish trend. After this, a candlestick with a big body and a small upper shadow or no shadow at all must form.
In most cases, the longer the candle, the more powerful the signal will be. Most importantly, the candlestick should be followed by a bullish candlestick.
Belt hold vs Marubozu
The belt hold pattern is usually similar to the Marubozu in that the two are formed by candles that have no upper and lower shadows.
As such, the two candlesticks are usually signs of reversals. Therefore, to a large extent, there is no major difference between the two.
How reliable is the belt hold pattern?
In our previous articles on candlestick patterns, we noted that most of them have different confidence levels. For example, whenever a hammer pattern forms, it increases the possibility that a new bullish trend will form. Similarly, a doji pattern usually has a high confidence level.
In this regard, we believe that the belt hold pattern is not a very reliable pattern. Therefore, you should use it with a lot of caution.
Trading the belt hold line strategies
As we have written before, candlestick patterns are important signals when trading all financial assets, including stocks and cryptocurrencies. However, in most cases, they should not be used alone.
Instead, you should use them based on the prevailing market conditions. Also, you should always use them in combination with other strategies.
Pending orders
One way of trading the bullish belt hold line is to use pending orders. A pending order directs a broker to execute a trade later when the price reaches a certain level. If the belt hold line happened at $10, you could place a buy-stop at $11 and a stop-loss at the lower side of the candle.
On the other hand, in case of a bearish belt hold line, you can place a sell-stop below the price and a stop-loss in the upper side of the candlestick.
Other reversal strategies
Another approach is to use it in combination with other reversal strategies. For example, you can use it with double moving averages. When the two moving averages make a crossover, it is usually a sign that the reversal pattern will be confirmed.
Summary
In this article, we have focused on what the belt hold pattern is in the financial market and how to use it well. We have also assessed some strategies to maximize its outcome. Basically, we have seen that the pattern is not all that effective.
External useful resources
- Statistics to prove if the Belt Hold pattern really works – Patterns Wizard
