The goal of every trader is to find the best entry and exit points. Unfortunately, it is not always possible to find these points. At times, even the best traders have bought the dip only for the financial asset to continue falling.
In this article, we will identify some of the best entry and exit indicators to trade all types of assets.
How trading works
Day trading is the overall process of buying and selling financial assets with the goal of generating short-term profits.
It differs significantly from the overall concept of investing. Investing is the process of buying undervalued assets and hoping that their value will rise in the long term.
Investors can hold their trades for a few weeks or even years. Indeed, Warren Buffett has had Coca-Cola in his portfolio for over three decades.
Traders are mostly focused on the overall price of the asset and don’t care about fundamental issues like valuations, revenue growth, and industry trends. In other words, they will trade any asset provided that its pricing is okay.
Traders make money by buying an asset whose price is expected to go up. They also make money by shorting a stock whose price they expect will continue falling. As such, they rarely have a long-term bias of an asset,
How traders identify entry and exit points
A common question is on how people identify the best entry and exit points. There are several approaches to this.
First, some traders focus on doing price action analysis. This is where they simply focus on the price of an asset and then identify unique patterns. The two types of patterns are candlesticks and chart patterns.
Candlestick patterns are those like doji, harami, and bullish and bearish engulfing patterns that historically mean something. For example, when a hammer pattern forms, it usually means that the asset price will likely have a bullish reversal.
Second, there are chart patterns that tell traders something. These patterns are divided into two: continuation and reversal patterns. When a continuation pattern happens, it usually means that the price will continue rising or falling.
On the other hand, if a reversal pattern happens, it means that the trend will start changing. Examples of popular chart patterns are bullish and bearish flag, rising and falling wedges, and head and shoulders pattern.
» Related: Learn When to Enter and Exit a Trading position
Why you should find the best entry and exit points
Another common question is why a trader should focus on finding the best entry and exit points in trading. The answer to this is relatively simple. When you are able to find the best entry and exit points, it will increase your profit potential.
For example, if a company’s share price has dropped from $30 to $20 in a certain period and you believe that it will bounce back, identifying the place where it will bounce back is significantly ideal.
Similarly, if a stock has been rising, identifying a location where you will short it will be good. If you can be perfect at identifying entry and exit positions, it means that you will be at a good place to make money.
Indicators to find entry and exit positions: which is the best?
Technical indicators are tools calculated using mathematical calculations that help traders determine whether to buy a stock or a currency pair. There are hundreds if not thousands of indicators today. Some of them are widely known and used by Wall Street traders. Others are developed and used by traders.
There are several types of technical indicators. For example, there are trend indicators that traders use in their trend-following strategies.
For example, if a stock is rising and it remains above a certain moving average, it means that the trader will be safe by remaining long. A danger sign will emerge when the price will start moving below this moving average.
So, let us look at some of the best indicators to help you find entry and exit positions.
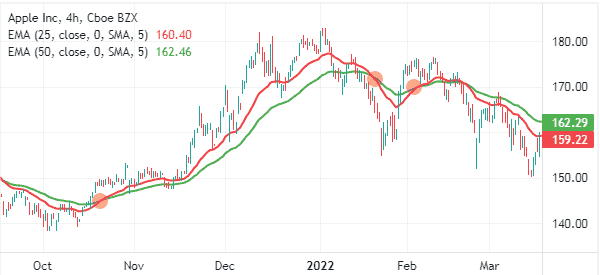
Moving averages
A moving average is a technical indicator that looks at the average price of an asset in a certain period of time. The simple MA is the most basic type of averages because it compares all the values equally. As such, it tends to have some significant lag.
Other types of moving averages are exponential, volume-weighted, smoothed, weighted, and least squares. You can find a fairly substantial list of Mas here.
In a moving average, you can identify a buy or sell trade when the price moves below or above the average. You can also find these points by checking out crossovers as shown below.
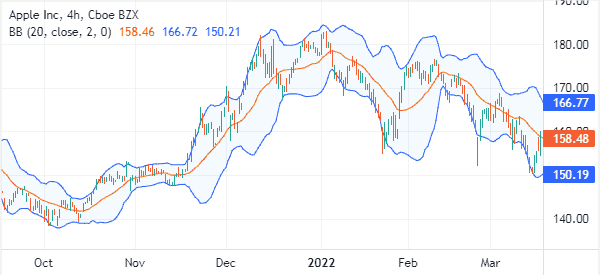
Bollinger Bands
It is possible to use Bollinger Bands to find entry and exit points. For starters, Bollinger Bands are three lines, with the middle one being the moving average and the two being the standard deviations.
A buy trade is identified when the price moves above the middle line and vice versa as shown below.
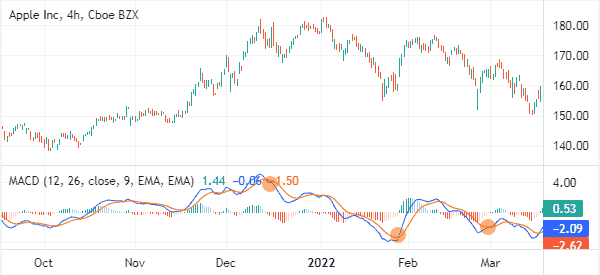
MACD
MACD is an indicator that is derived from moving averages. It simply transforms moving averages into oscillators.
Therefore, a buy signal tends to emerge when the two lines make a crossover when they are below the neutral line. On the other hand, a sell signal emerges when the crossover happens when the price is above the neutral line.
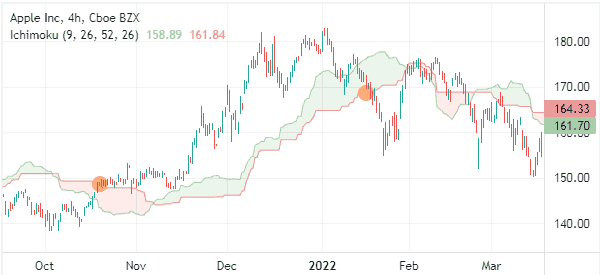
Ichimoku Kinko Hyo
Ichimoku is a leading indicator that has multiple lines. There are several strategies to use it to find entry and exit points.
For example, a bullish point can be found when the price moves above the Ichimoku cloud. A sell trade, on the other hand, is found when the price moves below the cloud.
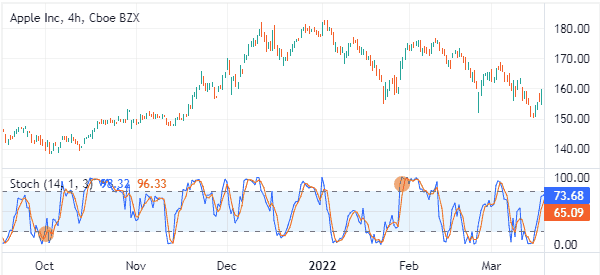
Stochastic oscillator
The Stochastic is an oscillator that has two lines. It is mostly used to identify overbought and oversold levels.
Ideally, a buy signal emerges when it moves to the oversold level while a bearish signal happens when it moves to the overbought level.
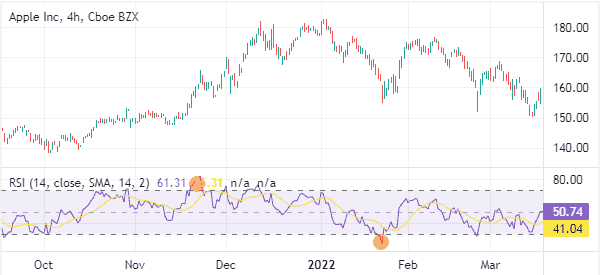
Relative Strength Index
The RSI is the most popular oscillator in the market. It is primarily used to identify overbought and oversold trading levels.
A bullish signal emerges when it moves to the oversold level and vice versa. However, like all oscillators, these signals can be inaccurate.
Summary
It is not always possible to find the best entry and exit points. In fact, it is almost impossible to find a trader who finds these points every single time.
Still, using these tools, can help you become a better trader. All you need to do is to practice and see the best way to approach them.
Honorable mention: the Supertrend Indicator. This tool tells you exactly when to buy and sell. Unfortunately, being not widely known, it often needs other indicators to support its analysis, so for now, we do not consider it worthy of being among ‘the best’.
External useful resources
- Forex Exit Indicators: When to Exit Your Trade and Take a Profit – Valutrades
