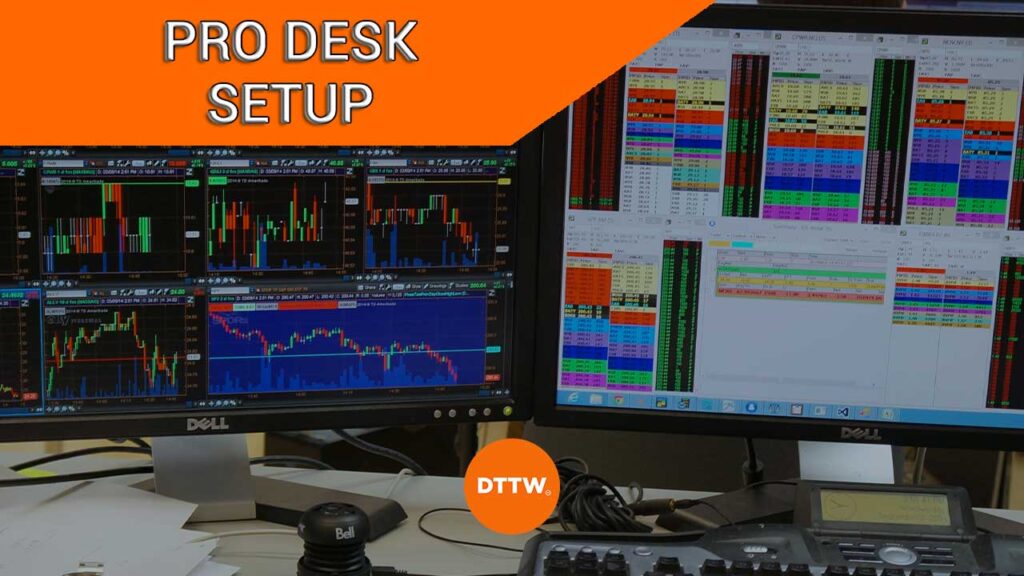
Professional day traders use different trading approaches to make decisions. Some Robinhood traders focus on their mobile applications to buy and sell coins. On the other hand, professional traders working for home offices, investment firms, hedge funds, and banks tend to have more sophisticated setups.
Most of these professional traders typically use multiple screens, unlike many normal traders who focus on one screen.
In this article, we will look at some of the most important screens that you can consider using either as a retail or professional trader.
Related » How to Setup Your Day Trading Room
Broad market performance
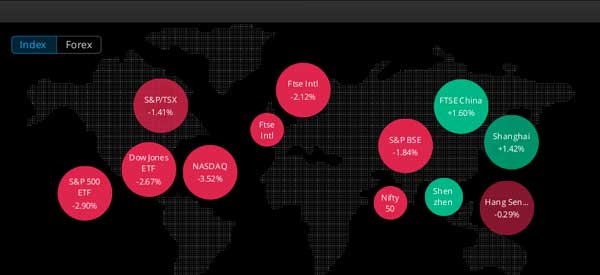
One of the best screens that you should have is one that shows you the broad performance of the financial market. In this, you can look at the overall performance of key global indices like the Dow Jones, Nasdaq 100, Stoxx, and DAX index. The goal of this dashboard is that it helps you to gauge the performance of the stock market around the world.
For example, in most cases, when American indices like the Dow Jones and Nasdaq100 indices close deeply in the red, there is usually a higher chance that Asian and European indices will also open in the red.
The chart below shows a broad summary of the performance of global indices. This is one of the most important dashboards that many professional traders look at.
Top movers
Another important dashboard to look at in the market is on top movers. This dashboard typically shows stocks that could draw interest to the trader. There are several types of these movers that you should always focus on.
- Premarket movers – These are companies that are making a lot of market action before the regular session opens. These are usually very important stocks since they tend to have the most action in the financial market.
- Top gainers and top losers – The next key dashboard is on the top gainers and losers. This dashboard usually shows companies that are either doing remarkably well or those that are lagging the market.
- 52-week high and 52-week low – These are stocks that are making their 52-week high and lows. This is a good dashboard to show momentum stocks.
A good example of this top movers dashboard is shown in the chart below.
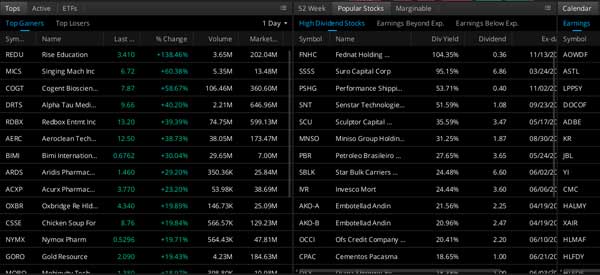
In line with this, many professional traders usually have a watchlist of the stocks that they follow. They can tweak this watchlist and rank them by performance.
News and calendar dashboard
Traders depend on news and economic events to determine whether to buy and sell assets. In most cases, stocks tend to rise and fall when there is important news.
As shown below, the DocuSign stock price crashed hard in May 2022 when the company published weak results.
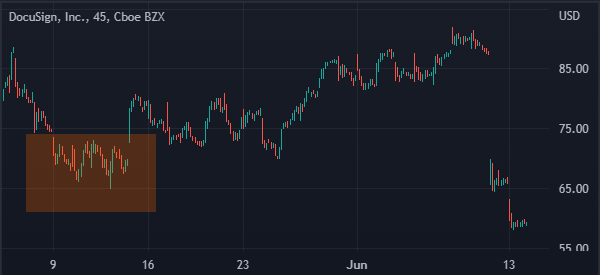
Therefore, professional traders always want to be the first to know when news breaks.
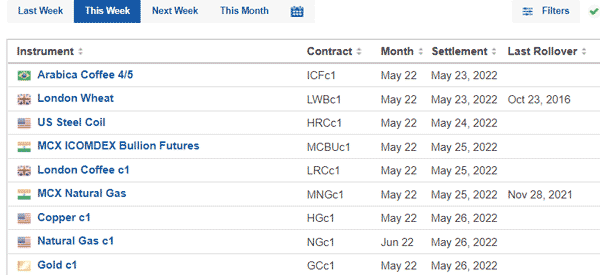
Calendars
One way they achieve this is by using calendars to anticipate news. An economic calendar gives a schedule of the key economic numbers that are expected to come. Examples of these numbers are inflation, unemployment rate, and manufacturing data.
Another calendar is earnings, which shows a schedule of companies that will publish their results in a given day. As such, a trader can be prepared for major market moves when these companies publish results.
The chart below shows how an economic calendar looks like.
News tab
The next important dashboard is on news. Traders use several news dashboards to get the most up-to-date news events in the market. For advanced traders, the most useful tools are highly expensive and are not affordable to most people. They include Bloomberg Terminal and Reuters Eikon.
Still, there are many free and affordable dashboards like Yahoo Finance and WeBull. The chart below shows the news stream portal in WeBull.
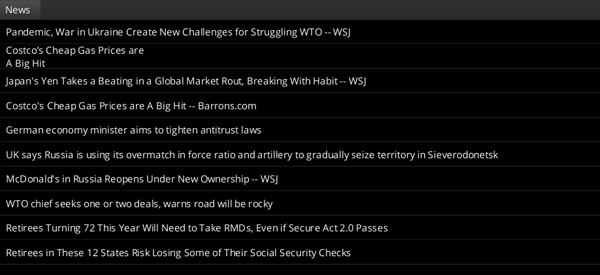
You can also go to news that are specific to a company. For example, when you see a stock rising or falling, you can quickly assess its specific news portal to see the reason.
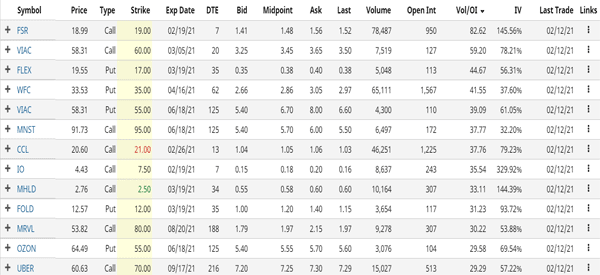
Options data
Many traders use data in the options market to determine whether to buy or sell stocks. The most important data they look at is the unusual options data, where there is a big options trade for a future date.
This trade is usually done either by an insider who expects a major market activity or by a large hedge fund that wants to hedge against risk.
The chart below shows how this unusual options data.
Other dashboards
Time and sales
Time and sales is another useful dashboard that professional traders. It is a level 2 data that shows the overall flow of orders executed by various market makers. A trader can use this data to determine whether to buy or sell an asset based on order flow.
Charts
The final key part of a professional trade setup is about the chart. Ideally, traders focus mostly on multiple charts, starting from a larger one to a smaller one. This is known as a multi-timeframe analysis.
The longer timeframe is used to show the long-term trend while the mid one is used to verify the trend. These two are also used to identify the key support and resistance levels. Finally, the third chart is the main one, where the trader executes their trade.
This strategy is known as the rule of three, but even more charts can be used to identify one’s entry point.
Summary
In this article we looked at what a typical professional trader’s workstation looks like. Still, some traders have found a lot of success by just using a single chart.
Although this choice is subjective, we believe that these parts shown above are the most important.
External useful resources
- Best trading screens & computer setup for day trading in 2022 – Asktraders
