Reversal patterns refer to chart arrangements that happen before a chart starts a new trend. For example, a bullish reversal pattern will typically happen during a downward trend and lead to a new bullish trend.
These patterns can help you make better decisions about when to enter a trade. In this article, we will look at the best reversal patterns – classical and candlesticks – to use.
» Related: How to trade reversal patterns
Differences between reversal patterns and indicators
A technical indicator is a mathematical tool that guides a trader about the next price action. For example, the Relative Strength Indicator can be viewed as a reversal indicator. This happens because the asset starts a new trend when the asset moves to an overbought or oversold level.
A reversal pattern, on the other hand, is one that you can see visually. Therefore you must be trained to recognize patterns just by looking at a chart.
What type of trader needs these patterns
Reversal patterns are used by all types of traders and investors. In most cases, it depends on the period of the chart used.
For example, if a head and shoulders form on a daily chart, it means that a position trader can open a short trade and hold it for a while. Similarly, if it happens in a 5-minute chart, a day trader can open a short intraday trade.
» Related: How Many Timeframes Should You Use?
Top 5 classic chart reversal patterns
These are patterns that happen in a chart and those that can be seen easily by just drawing lines. Here are some of the popular examples.
Head and shoulders
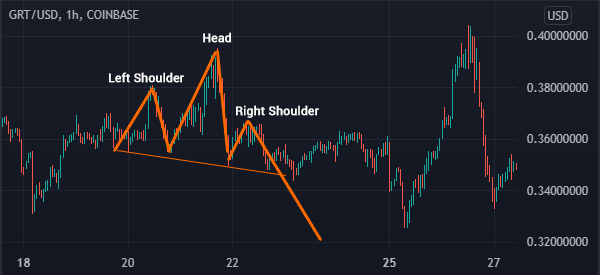
This pattern happens during an uptrend and as the name suggests, it has four key parts: right shoulder, head, left shoulder, and the neckline. In most cases, it usually leads to a new bearish trend.
The target of the price is estimated by calculating the distance between the head and the neckline. An inverse H&S pattern is a bullish reversal one. A good example of the head and shoulders pattern is shown below.
Wedges
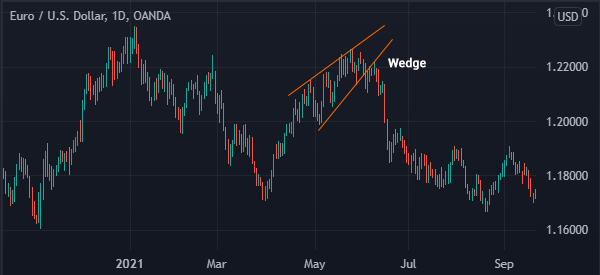
A wedge pattern is a reversal pattern that happens in both long and short-term charts. A rising wedge is drawn by connecting the key resistance levels and support levels of the chart. The two lines will typically converge in a pattern that resembles a triangle.
The pattern usually leads to a bearish breakout of a chart while a falling wedge leads to a bullish breakout.
Double Top
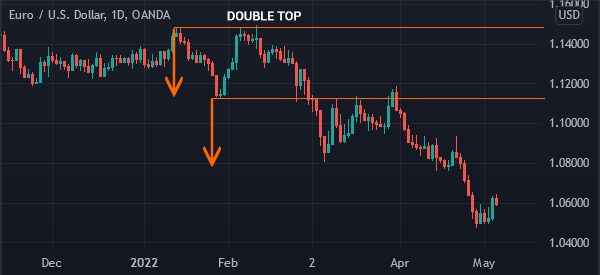
A double pattern forms during an uptrend. It forms when an asset price rises to a certain level of resistance, such as $10, and then it retreats briefly. The price then rises and tests the initial resistance level.
This performance usually means that there are not enough buyers in the market to push it much higher. As a result, it will likely lead to a bearish breakout. The target price is usually estimated by measuring the distance between the top and the chin.
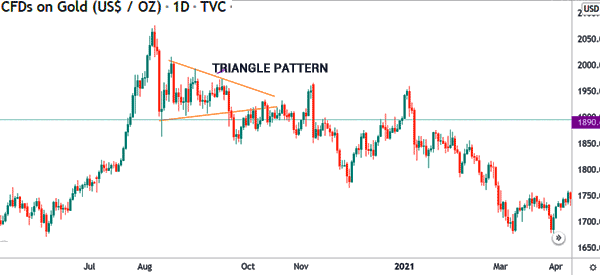
Symmetrical triangle
There are three types of triangle patterns: symmetrical, ascending, and descending patterns. The latter two patterns are usually signs of a continuation. For example, an ascending pattern tends to lead to a bullish breakout.
A symmetrical triangle can have a breakout in either direction. Therefore, as shown below, it is not a perfect reversal pattern.
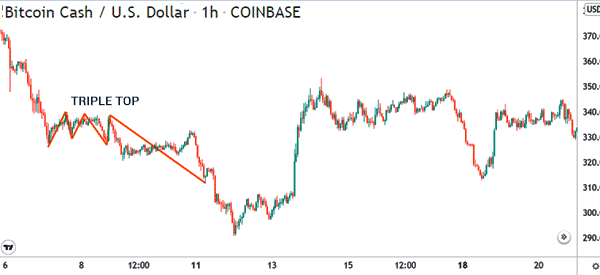
Triple top
The concept of a triple-top pattern is similar to that of a double-top. The price will rise to a certain resistance ($10) and then it retreats to a support level ($8). It will then rise and retest the resistance at $10, and then retrace.
In the final leg, the price will retest the resistance at $10 and then move sharply lower. An example of a triple top is shown below.
Top 5 candlestick reversal patterns
How to spot a reversal in candlesticks
Candlestick patterns are different from chart patterns. A candlestick pattern happens in a specific candlestick. They can also form in two or three candlesticks.
Therefore, to spot a bullish reversal candlestick, the pattern needs to first be in a bearish trend. It will then bounce back if the pattern forms. Here are the most popular reversal patterns.
» Related: You Must Analyze the Shadow of a Candle!
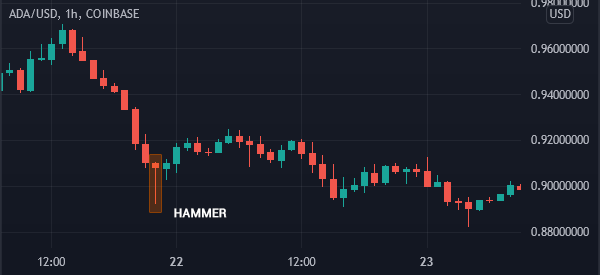
Hammer pattern
A hammer forms in a bearish trend. It is represented by an extremely small body and a long lower shadow. In most periods, the hammer does not have an upper shadow.
When it forms, the pattern is usually extremely short. An inverted hammer is also usually a bearish sign.
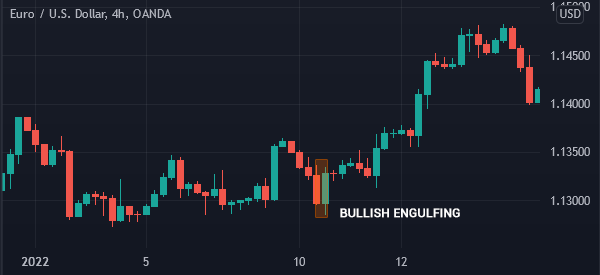
Engulfing
An engulfing pattern is a two-candle reversal pattern that happens during a bearish trend. The pattern is usually characterized by a small bearish candlestick that is then followed by a large bullish candle.
The latter candle usually engulfs the body and shadows of the initial candle. A bearish engulfing pattern is the exact opposite.
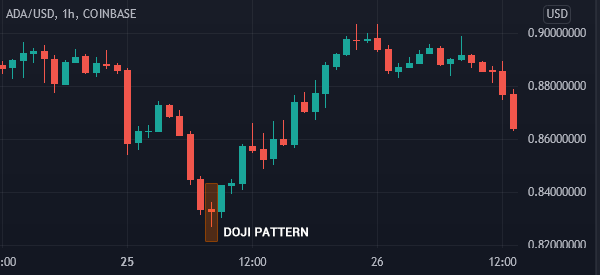
Doji
A doji pattern is one where the asset opens and closes at the same level. The pattern has an extremely small body and small upper and lower shadows as well. As such, it usually looks like a plus.
There are other types of doji patterns, including gravestone and dragonfly doji patterns. In most cases, the pattern usually leads to a bullish breakout when it happens during a downtrend. It can also lead to a bearish breakout when it happens during an uptrend.
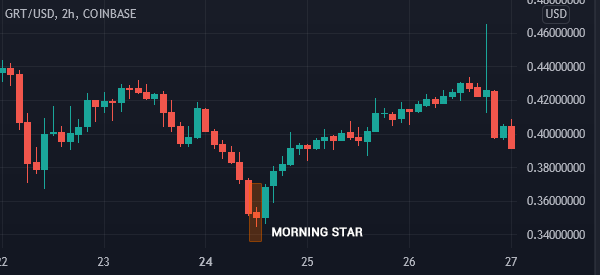
Morning star pattern
A morning star pattern is a bullish that has a close resemblance to the doji pattern. It is also characterized by a small body and a small body that happens between two large bearish and bullish candlesticks.
A good example of this is shown in the chart below. The opposite of a morning star is an evening star and it happens during an uptrend.
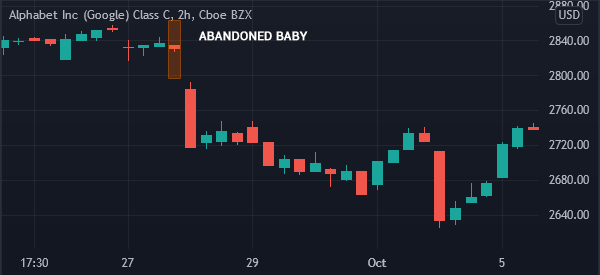
Abandoned baby
An abandoned baby candlestick pattern happens when an asset forms a bearish gap. This gap leads to an extremely small candle that is separate from the initial bearish candle. The chart below shows an example of an abandoned baby candlestick pattern.
Summary
Reversal patterns are popular ways of analyzing the market and identifying market opportunities. In this article, we have looked at some of the most popular reversal patterns both classical and candlestick -together with their examples.
External Useful Resources
- Market Reversals and the Sushi Roll Technique – Investopedia
