Scalping is a popular day trading strategy that involves buying and selling financial assets within a short period. In most cases, scalpers hold their trades for less than five minutes.
Their goal is to identify a trading opportunity, place a trade, and then exit with a small profit. In this article, we will look at the best scalping indicators to use.
How scalping works
Scalping is an extreme short-term trading strategy where a trader buys and sells assets like stocks and commodities within a short period.
For example, they can place a buy trade, make a small profit, exit, and then find another one. As such, scalpers can open more than 20 trades per day and make a small profit in each of them.
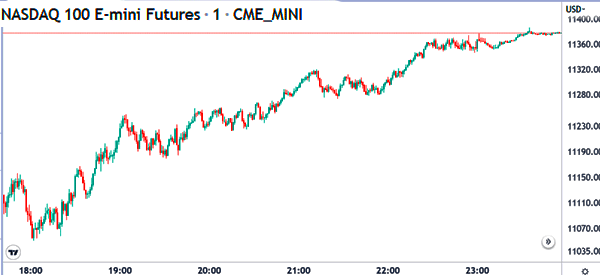
Scalping works by people using extremely short-term charts. Most scalpers use charts that are less than 5-minutes. They then identify chart patterns and open trades based on it.
For example, the chart shows a one-minute chart for the Nasdaq 100 index. Since the chart is trending, one can place a buy trade and ride it until a reversal happens.
Scalping strategies
Successful scalpers use different trading strategies in the market. For example, there are those who focus on trend-following while others aim to identify reversals. Trend-folowing involves identifying a pre-existing trend and then following it.
Other scalpers use price action strategy, where they focus on patterns like triangles, rectangles, head and shoulders, rising and falling wedges, and bullish and bearish flags and pennants.
Most of these strategies are used for identifying breakouts. For example, a rising wedge usually leads to a bearish breakout while a head and shoulders leads to a bearish breakout.
Related » The Best Ways to Identify and Trade Breakout Patterns
Most scalpers use an extremely tight multi-timeframe analysis. This is where they start their analysis on a short-term chart like a 5-minute one and then move to a one-minute chart.
This is different from what other day traders do, who begin from a hourly to a 30-minute and then to a 15-minute chart.
Related » How to Hugely Improve Your Scalping Trading Strategy
The Best scalping indicators
VWAP
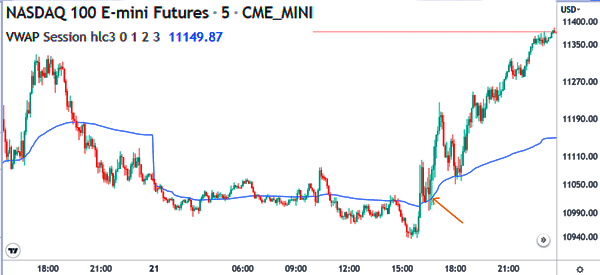
The Volume-Weighted Average Price (VWAP) is one of the best indicator for scalping. Indeed, because of how it is created, the VWAP indicator is only used for scalping.
The indicator is calculated by taking the volume of an asset in a certain period and then dividing it by the total shares bought.
It appears like a single line. As shown below, a scalper would have bought the Nasdaq index when it crossed the VWAP indicator and then held it for a while.
Exponential moving average (EMA)
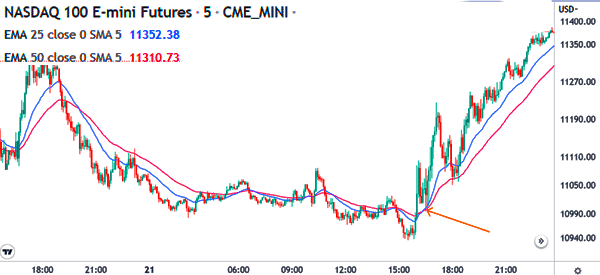
EMA is a type of moving average that gives more weighting for the most recent data. It is a common scalping indicator because it reacts faster than the simple moving average (SMA). There are several strategies for using it when scalping.
For example, you can place a buy trade when an asset crosses the moving average. Alternatively, you can use it in trend-following, where you buy an as long as is above the moving average.
In addition, you can use moving average crossover to identify when there is a reversal. A good example of this reversal strategy is shown below.
Other types of moving averages like the Simple Moving Average (SMA), Smoothed Moving Average, and Volume Weighted Moving Average (VWMA) are used the same way in trend-following.
Bollinger Bands
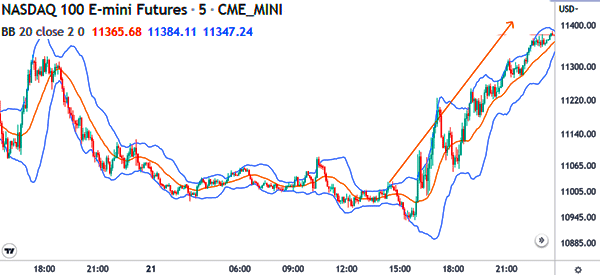
Bollinger Bands is another scalping indicator that was developed by combining moving averages with standard deviation. The middle line of the indicator is the moving average while the upper and lower lines are the standard deviations.
Bollinger Bands are used in scalping in several ways. For example, some traders buy and hold an asset as long as it is going upwards and is between the upper and middle lines of the bands.
Others sell as long as it is between the lower and middle lines of the bands. A good example of this is shown below.
Stochastic Oscillator
The stochastic oscillator is a popular tool that is used to identify overbought and oversold levels. It is calculated by comparing the closing price of an asset to its high-low range in a certain period. It has a close resemblance to the Relative Strength Index (RSI) only that it has two lines.
The Stochastic Oscillator can be used in scalping in a number of ways. For example, it can be used to identify overbought and oversold levels. As such, one can buy when an asset when it moves to the oversold level and short it when it moves to the overbought point.
Second, one can use the Stochastic Oscillator to find divergencies. A divergence is a period when an asset rises while the stochastic oscillator is falling. However, in most cases, the Stochastic Oscillator is not the best one for scalping.
Relative Strength Index (RSI)
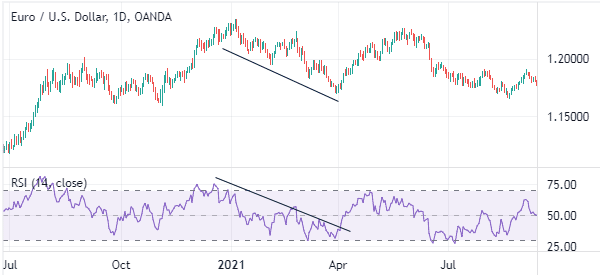
The RSI is another popular oscillator that is used mostly to identify overbought and oversold levels in the market. It measures the speed and change of price movements.
The RSI usually oscillates between 70 and 30. A move below 30 is a sign that an asset is oversold while a move above 70 is a sign that is overbought. Like the Stochastic Oscillator, it can be used to trade divergencies.
However, it is not that good scalping.
For one, an asset can continue rising when the RSI moves in the overbought level. A divergence pattern can also take too much to lead to a breakout. A good example of the RSI being used in trend-following is shown below.
Parabolic SAR indicator
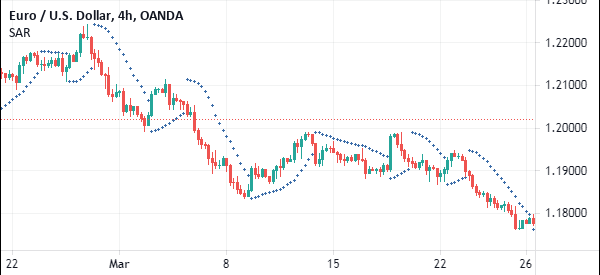
The Parabolic Stop And Reversal is a trend indicator that is characterised by a series of dots above and below the price.
A buy trade emerges when the price is above the price. On the other hand, a sell-trade happens when the price is above the parabolic dots.
Summary: the best indicator for scalping
In our opinion, We believe that the VWAP and Exponential Moving Averages are the best scalping indicators. They are both easy to use and have an easy way to identify signals.
However, we recommend that you spend a lot of time doing a lot of work testing (and then backtesting) them.
External useful resources
- A guide to scalping forex – CMC Markets
