Trend trading is the practice of following an already formed trend in the financial market. It differs from reversal trading, which is all about identifying periods when an existing trend is about to form.
Trend-following, when done right, is the best-trading strategy in the world because it lets traders make money for a long time. As we will note in this article, there are many popular indicators that people can use in this strategy. It is also an easy-to-use strategy among beginner traders.
Most trend traders use several technical indicators to help them make these decisions better. In this article, we will look at the top nine best trend trading indicators to use in day trading.
Why traders need trend indicators
Trend indicators are essential in day trading for a number of reasons. Some of these common reasons are:
To follow the trend
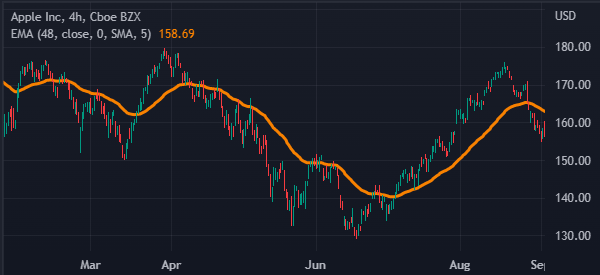
The first main reason why it is important to use trend indicators is that they help you follow a trend well. For example, in the chart below, we see that the Apple shares are rising and are above the 50-day moving average. In this case, a trader can decide to maintain the bullish trade as long as it is above the MA.
To know when to exit
This is another reason why people use trend indicators is to know when to exit a trade. Just as in the example above, one can use the moving average to know when to exit it.
If it moves below the moving average and you are long, it is a sign that you should exit the trade.
To know when to buy or short
The other reason why you need trend indicators is to know when to buy or short an asset. For example, you can use moving average strategies like a golden cross and a death cross to idenytify when to buy or sell an asset. A golden cross happens when the 200-day and 50-day moving averages make a crossover.
To identify stop-loss and a take-profit
Finally, trend indicators can help you identify areas to place your stop-loss and take-profit. In some cases, you can place a stop-loss at the 50-day or a 25-day moving average.
Most accurate trend indicators
Moving Average
Moving averages are the most popular indicators in the market. In fact, they form the foundation of other indicators like Bollinger Bands and MACD.
There are several strategies of using moving averages, including reversals. But the most popular one is in trend trading. This is where you add a moving average on a chart and hold the trade so long as the price is above or below this moving average.
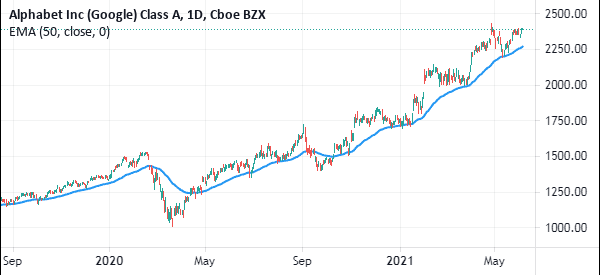
In the chart below, a trend trader would have continued to hold the Alphabet shares so long as the price was above the 50-day exponential moving average (EMA).
Other types of moving averages uses are simple, smoothed, and hull, among others.
MACD
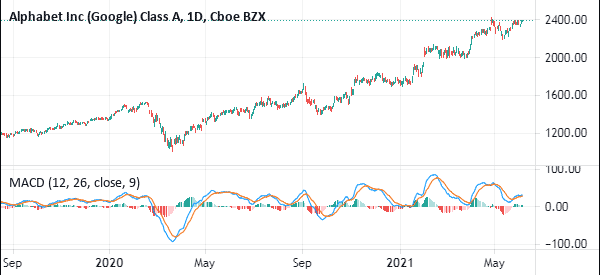
The Moving Average Convergence Divergence (MACD) is an oscillator that is derived from two moving averages. By default, the fast MA has a length of 12 while the slow MA has a length of 26. The MACD is popularly used in trend following and in reversals trading strategy.
In reversals, the signal emerges when the two moving averages make a crossover below the neutral line. When a bullish trend is on, the two lines keep rising, with the signal line being lower than the MACD line. After crossing the neutral line, the two lines must remain there during a bullish trend.
The chart below shows the MACD applied on the Alphabet chart.
Relative Strength Index (RSI)
The Relative Strength Index (RSI) is the most popular oscillator in the financial market. You have probably heard more about it in popular financial trading shows, including by Jim Cramer.
The indicator identifies the momentum of assets like stocks, currencies, and exchange-traded funds (ETFs).
In most cases, the Relative Strength Index is used to identify overbought and oversold levels. An asset is said to be extremely overbought when its price has been in an extended period of gains. It is said to be oversold after falling substantially over time,
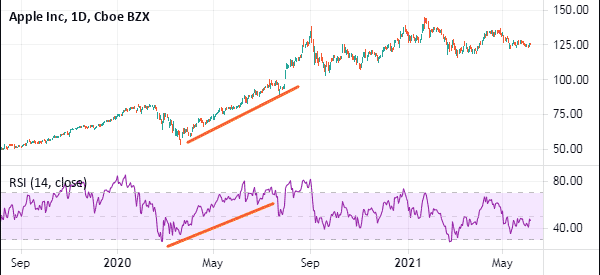
As you may have guessed from the main topic of the article, You can use the RSI indicator in trend following as well. Buy signals emerge when the indicator keeps moving upwards while sell signals come out when the indicator keeps falling.
The chart below shows the RSI indicator applied on the Apple shares chart.
Bollinger Bands
Bollinger Bands is an indicator that is derived from moving averages and standard deviation. The middle line of the indicator is the moving average of a certain period while the upper and lower line are the standard deviations. In most cases, the moving average used is usually 20 while the standard deviation is 2 (with 0 offset).
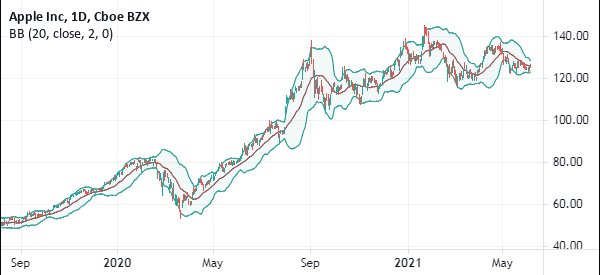
Bollinger Bands are mostly used in trend following strategy. In most cases, during an uptrend, the price usually remains between the middle and upper lines of the indicator. Therefore, the idea is to buy so long as the price is between these two lines.
On the other hand, sell signals emerge when the price is between the lower and the middle line. A bearish trend will be strong when the price is along the lower line of the bands. The chart below shows the Bollinger Bands applied on the Apple shares.
Ichimoku Kinko Hyo
The Ichimoku Kinko Hyo is the scariest technical indicators in the market. However, experienced traders view it as one of the easiest-to-use and one of the most accurate. The indicator is made up of several lines, including the conversion, baseline, lagging span, and lead 1 and 2.
There are several strategies of trading using the Ichimoku cloud. For example, you can identify reversals when the conversion and base lines make a crossover. You can also use it in trend following. You can use two main approaches to this.
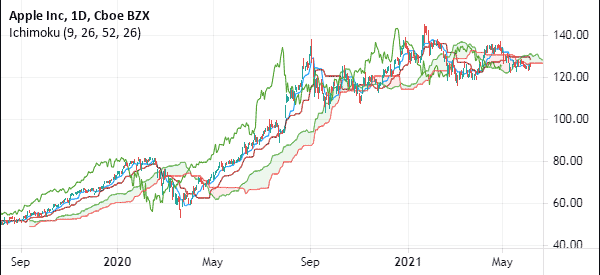
First, you can use the Ichmoku cloud. A bullish trend remains in a bullish view when the price is above the Ichimoku cloud. Second, you can use the lagging line. In a bullish trend, the price will be above the lagging line.
The chart below shows the Ichimoku on the Apple shares.
Stochastic Oscillator
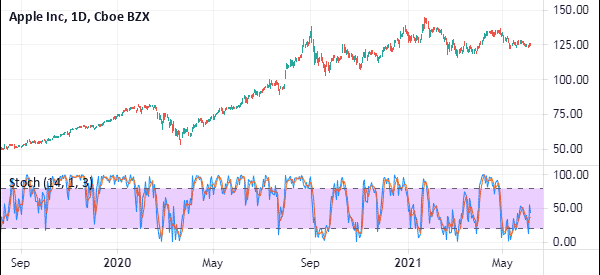
The Stochastic is a popular oscillator that is mostly used to identify overbought and oversold levels. The indicator has two lines that are known as %D and %K. It also has the upper band and lower band, which are at 80 and 20.
In most cases, buy signals emerge when the two lines make a crossover below the lower band while sell signals are made when there is a crossover above the upper band. After the crossover, the bullish trend remains as long as the two lines are moving upwards and vice versa, as shown below.
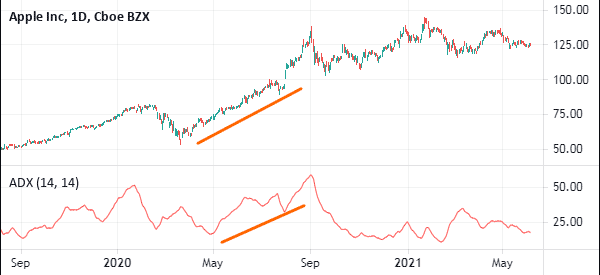
ADX
The Average Directional Moving Average (ADX) is an indicator that is widely used in trend trading (mostly to measure the strength of the trend). The indicator resembles oscillators like the Relative Strength Index (RSI) and momentum indicators. It ranges between zero and 100.
In most cases, a bullish trend will remain so long as the ADX is rising and vice versa. However, many critics point to the fact that this indicator tends to provide the wrong signals several times. We refer you to the dedicated page to find out more about strategies for using the ADX.
Advance-Decline Line (ADL)
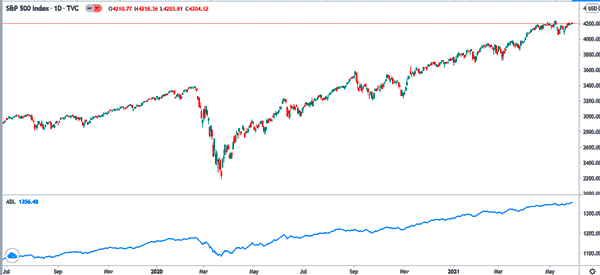
The Advance-Decline Line is an indicator that is popularly used to trade indices like the Dow Jones and the S&P 500. The indicator is calculated by looking at the number of advancing stocks and those that are falling in a session.
If the number of advancing shares is more than those that are falling, the indicator will keep rising, and vice versa. If the indicator is falling even as the indicator rises, it tells you that the rally is being controlled by just a few companies.
The chart below shows the ADX applied on the S&P 500 index.
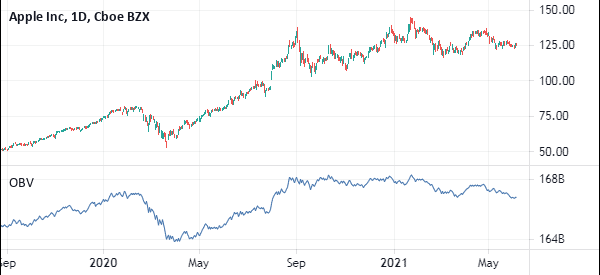
On Balance Volume (OBV)
The On Balance Volume is an indicator that is relatively similar to the ADL. Instead of looking at the number of advancing and falling stocks, it looks at their volume (a very important point for day traders).
Ideally, a bullish trend remains intact as long as the On-Balance-Volume is rising and vice versa. The chart below shows the OBV indicator used in the financial market.
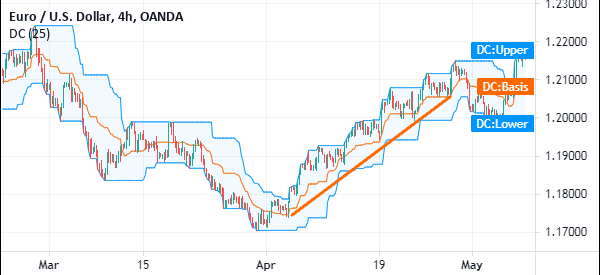
Donchian Channels to follow the trend
The Donchian Channels is an indicator that resembles the Bollinger Bands. It has three lines, with one in the middle and two others surrounding it. The only difference between the two is their calculation. In the Donchian Channels, you simply identify a period and identify the highest and lowest points. These will form the outer bands of the channel. The middle line will be the average of the two.
Like in the Bollinger Bands, the price will always remain in a bullish trend as long as it is between the middle and upper lines of the bands. If it moves below the middle line, it is said to be the start of the end of the bullish trend.
Similarly, in a bearish trend, the price will keep dropping so long as it is between the lower and middle lines of the channel, as shown in the chart below.
There are other indicators that are popular in trend following. For example, many day traders use oscillators like the moving average convergence and divergence (MACD) and the Relative Strength Index (RSI) using this strategy.
Summary
In this article, we have looked at some of the most popular indicators that traders use to follow the trends. Some like the moving averages are relatively popular and more accurate than the others like on-balance volume and advance-decline line.
External useful Resources
- Why You Should Trade with the Trend – Dummies
