Bollinger Bands is a popular technical indicator that was developed by John Bollinger. It is a useful indicator that brings a new twist to the role of moving averages. In this article, we will look at what Bollinger Bandwidth is and how you can use it in day trading.
What are Bollinger Bands?
To understand what Bollinger Bandwidth is, we need to first look at what Bollinger Bands are. It is an indicator made up of three lines. The middle line is the asset’s moving average while the two outer lines are the standard deviations.
The indicator is usually used mostly in trend following and in channel strategy. Many traders also use the tool in combination with other indicators. The chart below shows the Facebook chart with the Bollinger Bands.
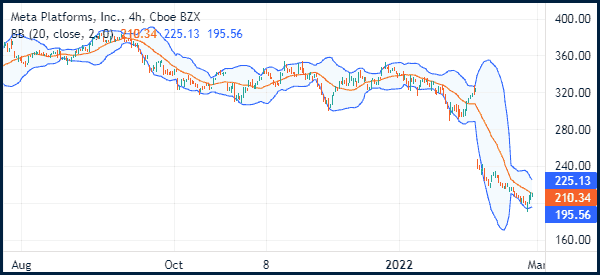
Ideally, the Bollinger Bands indicator is usually narrow when there is no market volatility while its gap increases when market conditions change.
What is Bollinger Bandwidth
Bollinger Bandwidth is an indicator that measures the percentage difference between the upper and lower bands. The width normally wides when Bollinger Bands widens and then increases when the Bollinger Bands rises. Therefore, it is an important indicator used to measure volatility in the financial market.
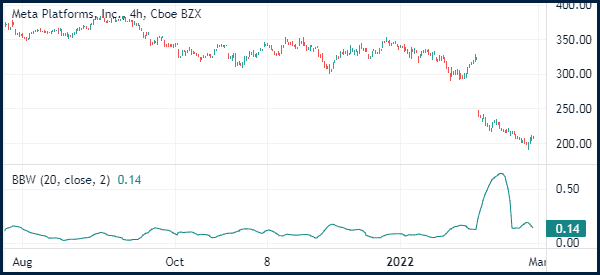
Because of how it works, the Bollinger Bandwidth does not have a close resemblance to Bollinger Bands. As shown below, the indicator is an oscillator that moves up and down. The chart below shows how the indicator is calculated.
How the BBW is calculated
The Bollinger Bandwidth is a relatively easy indicator to calculate. The first step is to calculate Bollinger Bands. Here, for first, you need to calculate the simple moving average of the asset. After this, you can calculate the positive and negative standard deviations of the asset.
The second step is to subtract the value of the lower band from the upper band. This result will show you the absolute difference between the two. Now, to get the Bollinger Bandwidth, you then divide the middle band to normalize the value.
Relation with the Bollinger Bands
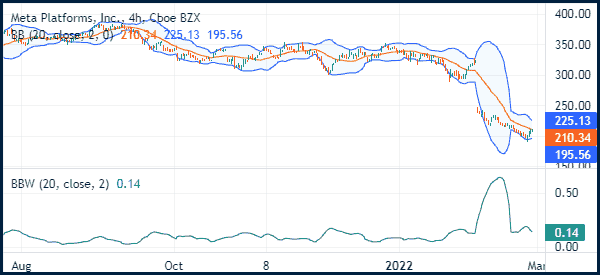
Therefore, as shown above, there is a close relationship between the Bollinger Bands and the Bollinger Bandwidth. The relationship is so intense such that there can be no Bandwidth without Bollinger Bands.
However, traders use the two indicators in a different manner. For example, there are those who use Bollinger Bands in trend-following and those who use it to find reversals. This happens by looking at where the price is in relation to the Bollinger Bands indicator.
On the other hand, the Bollinger Bandwidth is used as a measure of volatility. For example as look at the chart below shows that the bandwidth moved in a horizontal way for a long time. It then rose sharply when the stock crashed.
How to trade with the Bollinger bandwidth
While it is possible to use the Bollinger Bandwidth in the market, its role usually a bit limited. Traders adopt several ways to use it in the market. One method is to define narrowness.
When the bandwidth is narrow, it means that there is no volatility in the market. This is often known as a squeeze. When it happens, it means that there is a likelihood that a bullish or bearish breakout will happen.
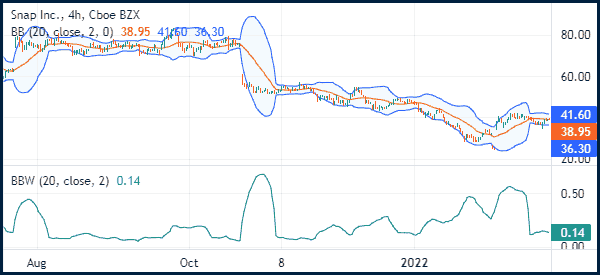
Another good example of this is Snap, which you can see in the chart below. As you can see, the Bollinger Bandwidth remained in a tight range before the stock collapsed. It then jumped sharply as the stock crashed. On the right side, the Bollinger Bandwidth remained at elevated levels ahead of the next earnings.
Therefore, in most cases, the Bollinger Bandwidth will not show you a signal of when to buy or sell an asset. Instead, it will guide you to be prepared of what will happen in the coming days.
How to read Bollinger Bandwidth signals
As mentioned above, it is a bit difficult to read Bollinger Bandwidth signals. This happens because its goal is not to send signals on when to buy or sell.
Like the Average True Range, the indicator tells you whether the market is volatile or not. With this information, you can then move ahead to open trades or anticipate moves.
At the same time, it is worth noting that the indicator can remain in a squeeze zone for an extended period of time.
Strategy example with Bollinger bands Width
While Bollinger Bandwidth is a good indicator to use, there are difficulties when it comes to use it in the market.
One way of using it is in double-bottom and double-top. A double-bottom is usually a bullish sign that leads to more upside while a double-bottom leads to more downside.
A good example of a double-top pattern is shown in the chart below. As you can see, the BTC/USD pair formed a double-top at 44,891 and a chin at 41,460. At the time, the Bollinger Bandwidth was at a narrow range. The indicator started moving upwards as the bearish breakout happened.
Summary
We have briefly explained what the Bollinger Bands are and then go to see in detail the Bollinger Bands Width, which are closely related to them (even if they have no similarity, and also their purpose is different). We have also assessed how you can use the indicator to read the market mood.
External useful resources
- How to Apply the Bollinger Bandwidth Strategy – DailyFx
