How do you identify a good place to enter a trade? This is a common question that new traders ask. As we have written before, there are many answers to this question.
For example, there are those traders who focus on fundamental analysis and others who use technical analysis. There are also those traders who use price action.
In this report, we will look at a price action that is known as a bull flag that traders use to identify points to enter trade. We will look at what a bullish flag is, its difference with bearish flag, and its examples.
What is a bullish flag?
At times, the price of an asset will move sharply upwards. This could be because of a major news event like better earnings forecast or a rate hike by the Federal Reserve. It could also be because of a sudden entry of bulls.
In most cases, when this happens, the price does rise infinitely. It rises and hits a break at a certain point as bulls take profit and as some bears start coming in.
When this happens, a pattern known as a bullish flag is usually formed. In other cases, a pattern identified as a bullish pennant can happen.
What is a bullish flag? A bullish flag is preceded by a sharp rise in the price of an asset and then followed by a simultaneous channel with a number of parallel resistance and support levels.
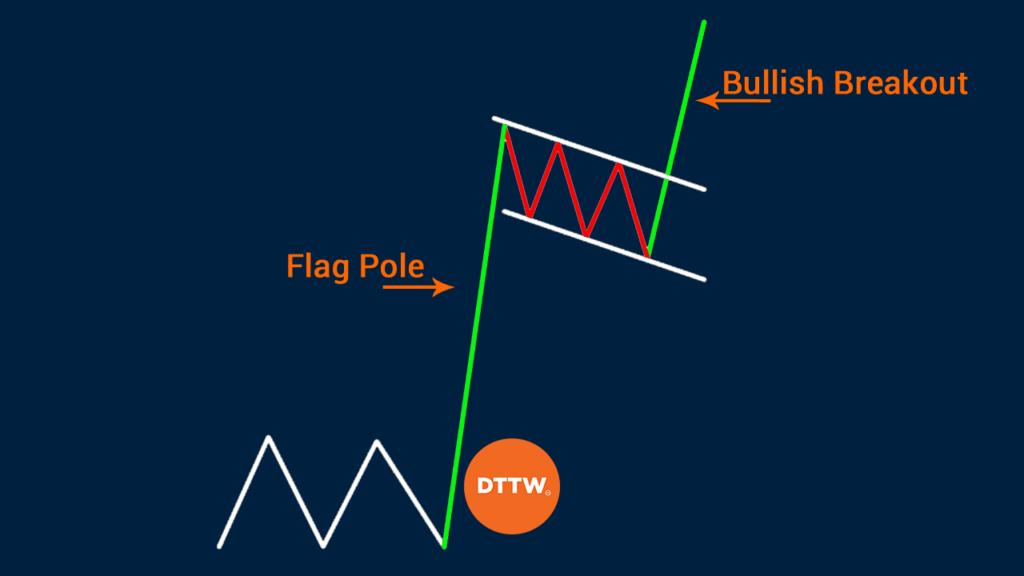
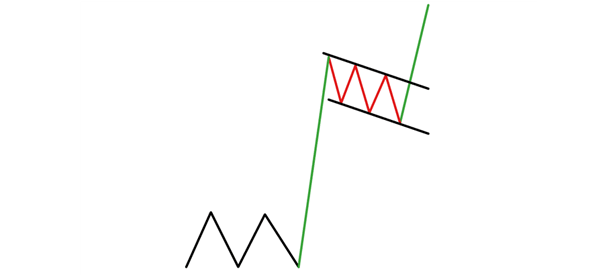
And this is usually relatively short. The image below shows the ideal parts of a bullish flag pattern.
The 3 Key Features
As you can see, the bull flag pattern has three key features. First, it is formed after the price of an asset jumps. This is the flag pole of this flag. Second, it has a consolidation phase, as bulls and bears battle it out. In most cases, this usually happens during a period of low volume.
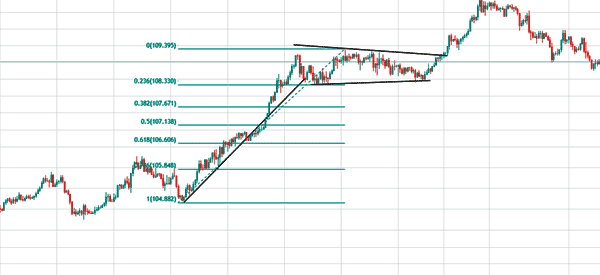
Most importantly, you need to ensure that the retracement does not go deeper than 50%. If this happens, it could be a sign thar a new trend is coming up. You should use a Fibonacci retracement tool to identify the retracement level.
In the chart below, we see that the USD/JPY formed a bullish flag. In the first instance, the price dropped to the 23.6% Fibonacci retracement level. Had it dropped below the 50% retracement, the pattern would have been invalidated.
Finally, there is a bullish breakout. As a result of this, the bullish flag pattern is known as a bullish continuation pattern.
Bull Flag vs Bullish Pennant
The only difference between a bull flag and a bullish pennant is that the latter usually forms a triangle pattern instead of a series of support and resistance patterns. When a bullish pennant forms, it usually sends a signal that the price will likely break out higher.
Typically, the key levels to watch in this case are the upper and lower sides of the pennant.
Practical Example
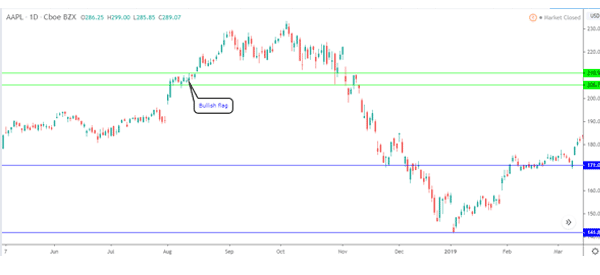
The chart below shows the daily chart of Apple (AAPL). As you can see, the stock was on a strong bull run, when it made a major gap on 31st July 2018.
Whenever a strong gap happen, many bullish investors are known to exit their trades on profit-taking. Some bears also go in, hoping that the price will decline.
When this happens, a bull flag pattern is formed.
Bullish flag strategies
As such, the best strategy is usually to buy the stock when it moves past the upper side of the channel.
This is contrary to what many strategists argue. Buying at the lower end means that you are risking your trade in case a new bearish trend form. Instead, buying at the upper side means that bulls are usually in control.
Use a buy stop order
Another popular strategy when using the bullish flag is to use a buy stop order. In this case, you should place a buy stop slightly above the upper side of the flag. If there is indeed a bullish breakout, the buy stop will become the new buy order.
»Stop order vs Stop limit order«
What about a bearish flag?
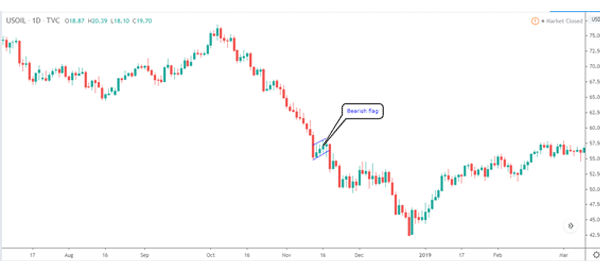
A bearish flag is the exact opposite of a bullish flag. It usually happens when the price declines sharply and then form some consolidation. The consolidation channel can be horizontal, falling, or rising.
When a bearish flag happens it usually sends a signal that bears are pausing. Ultimately, like the bullish flag, this pattern usually breaks out lower, as shown in the chart below.
› Bear Market: Definition and 5 Tips to Trade It
Pros of using the bullish flag
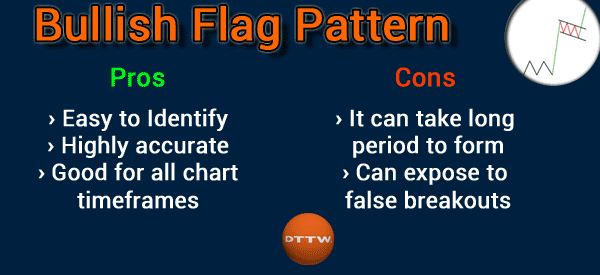
There are several reasons why many day traders use the bullish flag pattern. First, it is one of the most popular chart patterns in the market. It is very rare not to see it in the market on any given day.
Second, unlike most patterns, a bullish flag tends to be highly accurate. Third, the flag pattern is easy to identify and use in the financial market. Finally, the flag forms in all chart sizes from a 5-minute chart to a weekly chart.
Cons of using the bullish flag pattern
There are a few cons of using a bullish flag pattern. First, at times, the pattern can take a long period to form. It can even take months for the pattern to be confirmed. Second, the pattern can expose you to false breakouts if you are not careful.
Final thoughts
Bullish and bearish flags are important continuation patterns you can use in the market today. They are easy to identify and often accurate. Still, we recommend that you spend a lot of time learning them before you try them with actual funds.
External Useful Resources
- Are You Taking Advantage of These 3 Bull Flag Patterns? – TimotySykes
- Bullish Flag Formation – Hitandruncandlesticks
