The CBOE Volatility Index, commonly known as VIX, is one of the most popular gauges in the financial market.
Also known as the fear gauge, the index was designed to provide more information about the expected volatility of the S&P 500 index in the coming 30 days.
In this article, we will look at what the VIX index is and how to use this essential sentiment analysis tool in day trading.
What is the VIX index?
The VIX index is a sentiment analysis tool that was created by Cboe and Goldman Sachs to measure the probable range of movement in the US stock market. It looks to see whether the stock market will move above and below the present level.
It is possible to collect this data on the broad US equities market. However, the VIX index looks at the S&P 500 index, which is made up of the 500 biggest companies in the United States.
Therefore, when the VIX rises, it means that investors are anticipating more volatility. When it drops, it is usually a sign that the volatility has dried down.
The VIX index was not designed to be a tradable asset. Instead, it was created to provide sentiment investors and traders with a feeling about the market so that they can position their assets.
Recently, however, derivatives that track the VIX index have come up, making it a tradable financial asset.
Related » How to conduct a sentiment analysis
How the VIX index is calculated
The VIX index is calculated by looking at the implied volatility of the S&P 500 index. As mentioned, the S&P 500 index is the most ideal index because it is made up of about 80% of all companies in the United States.
The VIX uses the options market. For starters, options refers to trades that people place based on where they expect an asset to trade at in the future. A call option gives you the right to cash a settlement if the price is higher than where it is.
A put option, on the other hand, gives you the right to a cash settlement if the price is lower than the present level. Options differ from futures because holders are not obligated to buy or sell an asset.
The VIX index measures the implied volatility by looking at the average weighted price of these puts and call options. Also, the VIX uses the options market, instead of the spot prices because these options reflect the implied volatility that buyers and sellers expect in the market.
How to interpret the VIX index
The VIX index’s interpretation tends to depend on numerous factors. However, the general view is that the index rises when there is substantial volatility. When the index drops, it is a sign that the volatility is falling.
A good example of this is what happened at the start of the Covid-19 pandemic. As shown below, the index rose sharply to a high of $85.63. It was the highest level since 2009.
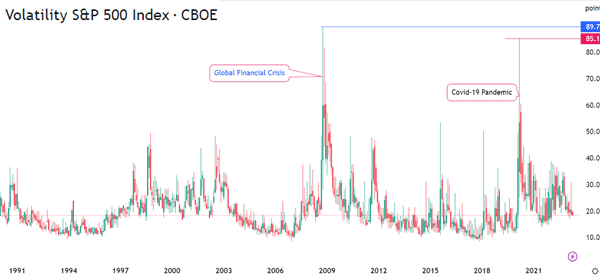
This chart also shows that the VIX index jumped to a high of $89.71 during the Global Financial Crisis (GFC). At the time, the market was extremely volatile as a likelihood of a bank failure in the US increased following the collapse of Lehman Brothers.
S&P Global, the giant financial data provider, has created a good chart to simplify the interpretation of the VIX index. Between 0 and 15, it means that volatility is low. Between 15 and 20, it signals that there is moderate or normal market conditions.
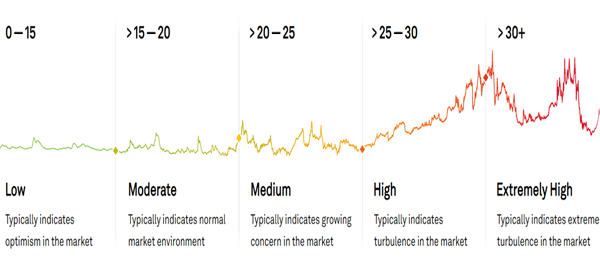
Between 20 and 25, the VIX usually shows that the volatility has medium volatility. In most cases, this situation signals that there is growing concern in the market. Between 25 and 30, it is a sign that volatility is rising. Finally, above 30, it is a sign that the volatility is extremely high.
Use it as a leading indicator
The second most important way you can use it in the market is to use it as a leading indicator.
A leading indicator is a tool that tells you what to expect. A rising VIX is usually an indicator that there could be volatility in the coming days. Therefore, if you like trading in volatile markets, this is an indicator that you will apply your strategy.
If you dislike volatility, a declining VIX is an indicator that there will be no much actions ahead.
However, not all lagging and leading indicators are always accurate. There are times when the VIX will send the wrong signal.
Therefore, it is important for you to apply other indicators in your decision-making.
How to use the VIX to estimate the future of the S&P 500
It is possible to use the VIX index to estimate the future performance of the S&P 500 index. And when you can predict the S&P 500, it is possible to estimate the performance of the Nasdaq 100 and Dow Jones indices because the two have a close correlation with each other.
For this calculation, we will use the S&P 500 index value of $4,105 and the VIX value of 18.4.
The first stage is where you convert the VIX index value into a percentage. In this case, the percentage is 18.4%. In the next stage, you should divide the annual percentage by the square rot of 12 for the VIX. The formula below shows how this is done:
| 18.4% / √12 = 5.31% |
The third stage is where you multiply this figure with the S&P 500 index figure. This is:
| 5.31X4,105 = 217.9 |
Finally, you establish the upper and lower floors of the index using these numbers. You do that by adding or subtracting the figure from the index.
| Upper level = 4,105 + 217.9 = $4,322.9 |
| Lower level = 3,550 -217.9 = $3,887.1 |
How to trade or invest in the VIX
As mentioned, it is not possible to trade in the VIX index directly. Instead, traders can trade in financial derivatives that track the index. Three of the most popular derivatives are CFDs, ETFs, and ETNs.
A CFD is a financial product that tracks the price of a financial asset. Holders of these products don’t hold the asset itself.
An ETF, on the other hand, is a financial asset that has a resemblance of a stock. They are created by index funds and then offered by companies like Vanguard and Schwab. These ETFs seek to replicate the return of an asset by buying its futures contracts.
An Exchange Traded Note, on the other hand, is a type of debt that provide a return on the benchmark index.
Traders can go long or short the VIX index using these financial instruments. Going long means buying instruments tied to the VIX and expecting that the price will continue rising.
On the other hand, going short means selling the index and expecting that the price will continue falling.
What moves the VIX index?
There are numerous factors that move the VIX index. As mentioned, the index is affected by the positioning of the options tied to the S&P 500.
Therefore, the most important movers of the index are:
- Market Sentiment – When investors are fearful or uncertain, they may increase their demand for put options leading to a rise in the VIX index.
- Earnings – The actual earnings may or may not match market expectations. A better-than-expected earnings report may lead to increased investor confidence, causing a decrease in volatility, and thus, a decline in the VIX index. The opposite could happen too.
- Supply and demand for options – If there is an increase in demand for options or extreme options prices, it could indicate increased expectations of higher volatility, causing a rise in the VIX index.
- Federal Reserve expectations – Sudden interest rate changes often raise market volatility levels.
- Geopolitical issues
- Commodity prices
among others.
Summary
In this article, we have looked at what the VIX index is and how it is calculated. Also, we have assessed how some of the top ways for trading the index and the differences between ETFs and ETNs.
Most investors and traders use the index to predict where stocks and other assets will move to in the future.
External useful resources
- VIX Chart by TradingView
- Vix on the official CBOE website
