The Chaikin oscillator is a relatively unpopular technical indicator that was developed by Marc Chaikin. Chaikin is a respected professional who founded Chaikin Analytics, a company that provides analytics, portfoliowise, Powerpulse, and PowerFeed.
Marc is also the founder of other indicators like the Chaikin Money Flow (CMF) that we have looked at before. He also makes some regular appearances on all financial media like Bloomberg, Wall Street Journal, and Barrons, among others.
Well… after having understood who developed the tool, what about going to see what it is, how to interpret it and how to use it?
What is the Chaikin Oscillator?
The Chaikin Oscillator is an indicator that looks at the accumulation and distribution line and the MACD. As such, it is widely known as an indicator of another indicator. The indicator measures the difference between the 3-day and 10-day exponential moving averages (EMA) of the accumulation and distribution line (ADL).
The ADL line is an indicator that measures the strength of a trend using the price and volume flow. The indicator rises during a period when the price and volume are rising, It then drops when the two are declining. The MACD, on the other hand, is an oscillator that is developed by converting two moving averages into an oscillator.
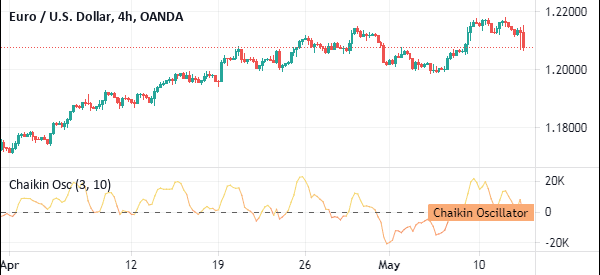
The chart below shows the Chaikin Oscillator applied on the four-hour chart of the EUR/USD pair. As you can see, the oscillator is made up of a single line that moves up and down. From a distance, it looks like the accumulation and distribution line and the on-balance volume (OBV).
How to calculate the CO
There are a few steps for calculating the Chaikin Oscillator. First, you need to calculate the ADL line. To do this, find a money flow multiplier. This is calculated using the formula below:
| MFM = [(close – low) – (High – Close)] / (High – Low) |
The next step is to get the money flow volume by multiplying the money flow multiplier and the volume for the period under study.
Next, you calculate the accumulation and distribution line by adding the previous ADL and the current period’s money flow volume.
Finally, you calculate the Chaikin Oscillator by substracting the 10-day exponential moving average of the ADL from the 3-day EMA of the line.
Like in all technical indicators, you can change these numbers depending on your trading style. Also, since most charting software already provide the indicator, you don’t need to manually calculate it. Instead, you can just apply the indicator and tweak it based on your needs.
How the use the Chaikin oscillator
As mentioned above, the Chaikin oscillator is an indicator of an indicator. This means that it is not directly attached to the asset’s price. For example, a simple moving average (SMA) is directly linked to the price of an asset.
The indicator is detached from the price because the price and volume are done from the accumulation and distribution line, as shown above. Second, the EMA is applied to the ADL line and not the price itself. Finally, the indicator is calculated by subtracting the long and short EMAs of the ADL. Therefore, this indicator does not tell a lot about the price.
As shown above, the Chaikin oscillator moves above and below the zero line. When it rises above the zero line, it shows that the ADL is rising and that the buyers are prevailing, among others. Similarly, when the indicator is falling, it is a sign that the sellers are prevailing.
How to trade with the Chaikin Oscillator
There are two main steps for using the Chaikin Oscillator. First, ensure that the price is not in a consolidation mode. Like most indicators, the Chaikin will not work well when the price is in a tight range.
Second, check the data that make the indicator. In most platforms, the fast length is usually 3 while the slow length is 10. But you can change these based on your strategy. Also, you can change the default colours to match your liking.
CO in trend following
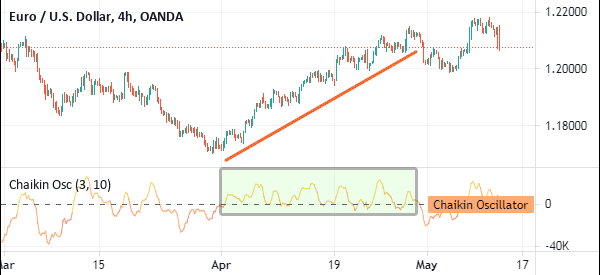
The Chaikin Oscillator can be used in trend following, mostly to complement other technical indicators like the moving averages (MA) and Bollinger Bands. Ideally, if an asset’s price is rising, the Chaikin oscillator should also be rising and above the zero line.
Therefore, you can interpret it as follows. An asset’s price that is rising will continue moving in that trend so long as the Chaikin Oscillator is above the neutral line, as shown in the chart below.
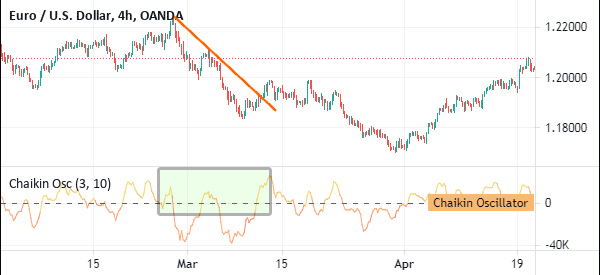
The opposite is also true, as shown below.
Using Chaikin oscillator to find divergences
A divergence is a situation where an asset’s price is going in the opposite direction as the indicator. Most oscillators, including the Relative Strength Index (RSI) and the MACD are all used to show divergence in the market.
The idea is relatively simple. For example, if the price of an asset is rising while the Chaikin oscillator is falling, this is a sign that a pullback will likely happen, and vice versa.
While divergences are good, they are relatively rare. In fact, they only happen over an extended period of time. This means that many day traders cannot use them on a regular basis.
Summary
The Chaikin Oscillator is a relatively rare technical indicator that very few traders use. However, it is one of the most efficient. In this article, we have looked at how you can calculate it and how you can use it in the market.
To succeed in it, you will need to spend a lot of time practicing in a demo account.
External Useful Resources
- Chaikin Oscillator: A great tools for traders? – PatternsWizard
