Confirmation is an important concept in day trading. It refers to a situation where traders use technical indicators or other price action techniques to confirm asset movements. This confirmation can be breakouts, reversals, and continuations.
In this article, we will look at some of the best techniques to confirm signals in trading.
Trading confirmation definition
Confirmation in trading is defined as the process where you validate a certain signal in the market. For example, when you are trading breakouts, you will need to validate them before you enter a trade. The same situation happens when you are trading reversals and continuation patterns.
In most cases, this confirmation is what separates professional and newbie or wannabe traders.
Confirmation can be done in the form of technical indicators like moving average and the Relative Strength Index (RSI). In other cases, it can be in form of how a chart behaves after a major move. It can also be in form of candlestick patterns.
Related » Checklist: What to Do Before You Place a Trade
What are confirmation signals and why do traders use them?
A confirmation signal is a tool that helps traders confirm certain moves in the market. These patterns don’t guarantee that an asset will trade in the breakout direction. Instead, they provide a high probability that the asset will move in the bias direction.
For example, if a stock or a commodity has made a hammer pattern, it usually implies that there will be a bullish breakout. However, since this can be a false breakout signal, then you need to confirm the situation before you open a trade.
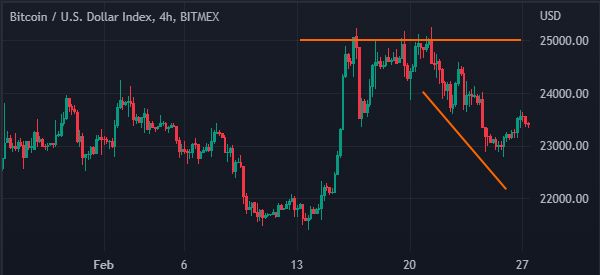
A good example of this happened in the crypto market in February 2023. At the time, Bitcoin made a bullish breakout above the $25,000 resistance level. It had struggled to move above that level for a while.
Therefore, since this was a breakout, traders needed for confirmation before they moved higher. Since this confirmation was not there, the coin retreated and moved below $23,000.
Confirmation signals are not always perfect and you should never use them alone. At times, it is important for you to use them in combination of both your trading strategy and other features and tools as well.
Top indicators to confirm trades
There are hundreds of technical traders that you can use to confirm a trade. These are, in our opinion, some of the best indicators that you can use to do this task.
Moving averages
Moving averages are popular indicators that traders use in all assets, including stocks and commodities. There are numerous types of averages, including:
- exponential
- simple
- volume-weighted
- smoothed
indicators. You can use these indicators to confirm trends, reversals, or breakouts in various ways.
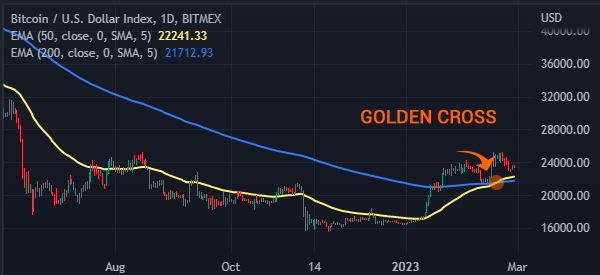
A popular approach is to use the death cross or the golden cross. A golden cross happens when the 200-day and 50-day moving averages make a bullish crossover.
As such, instead of buying an asset when it moves above the 50-day MA, you can wait for the confirmation to happen when it moves above the 200-day MA. A good example is in the BTC chart below.
Relative Strength Index (RSI)
The Relative Strength Index (RSI) is one of the most commonly used confirmation signals in the market. It is a technical indicator that is mostly used to identify overbought and oversold levels in the market. It is also used in trend-following trading.
Therefore, if you are using trend indicators like the moving average and Bollinger Bands, you can use the RSI to confirm a breakout or a trend.
MACD
The moving average convergence and divergence (MACD) is an indicator that converts moving averages into an oscillator. It is made up of two lines: fast and slow average, and a histogram.
There are numerous ways of using the MACD to confirm a trade. For example, if an asset is rising, you can implement a buy trade when the two lines of the MACD move above the neutral point.
Volume indicators
Volume is an important indicator that you can easily use to confirm trends. In fact, most people use the generic volume indicator to confirm a trade.
Others use volume indicators like the accumulation and distribution and money flow index (MFI) to confirm a trade. These indicators are essential in confirming breakouts when using trend indicators like moving averages and the volume-weighted average price.
Break and retest
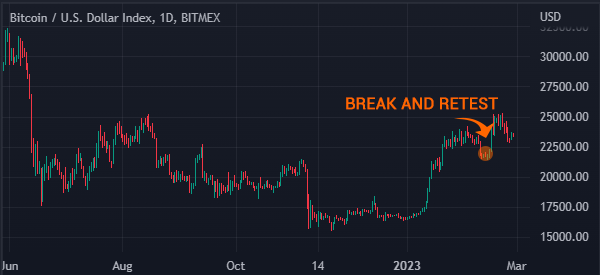
Break and retest is not an indicator. But based on our past experience, it is one of the easiest ways to confirm trends in the market. A good thing is that it works in most chart patterns, including triangles and double-tops and double-bottoms.
The idea is simple. In most periods, when a stock makes a bullish breakout above a triangle or a double-top, it will often retest the support or resistance and then resume the breakout direction. A good example of this is shown in the chart below.
Risks of using confirmation signals
There are several risks when using confirmation signals. First, some indicators and price action tool can lead to false signals.
For example, in many periods, buying an asset because the Relative Strength Index (RSI) moved to an oversold level can be a false indicator. Therefore, you should always use these confirmations well and cautiously.
Second, you can miss some good trades as you wait for a confirmation. A good example of this is in death and golden crosses. Perhaps, an asset can move above the 50-day moving average. It can then take more time before it moves to the confirmation area of 200-day MA.
Related » How to manage FOMO
Third, there is the risk of overtrading when there are too many trade confirmations in a given day. Finally, waiting for confirmation can take time.
When to avoid confirmations
We always recommend that traders should use some confirmations in the market. This means that you should not use a single indicator or technical chart to make decisions. You should always confirm a thesis before you trade with it.
However, there are several periods when you should avoid confirmations or simply use them sparingly.
First, at times, some technical indicators don’t work well when there are major events such as earnings and economic data releases. In these periods, you should use your experience to know how to allocate funds.
Second, in most cases, you should use these confirmation indicators sparingly when you are using short-term charts like one-minute or two-minute. Further, you should use them when there is significant market volatility.
Summary
In this article, we have looked at how to confirm trends and market moves. We have also assessed some of the top technical indicators to use when confirming breakouts and reversals. Using these tools will help you substantially.
External useful resources
- Trading Price Action With or Without Confirmation – Learn to Trade The Market
