The number of day traders is continually rising as more people seek to make money online and complement their income. But very few are successful; in fact 90% of traders lose money.
So..we must do everything to be in that profitable 10%!
In this article, we will look at some of the most important confirmations you need before you enter a trade. These points will apply to all traders, including stocks, forex, exchange-traded funds (ETFs), and commodities.
Catalyst
A catalyst is defined as a “substance that causes a chemical reaction to proceed at a faster rate.” The same definition can happen in the financial market. It basically refers to the reason why you believe that a financial asset’s price will rise or decline. There are several catalysts in the financial market, including:
- Mergers and acquisition – You could buy a stock hoping that the company will get acquired by a bigger company.
- Earnings and revenue growth – You could buy a stock hoping that the company’s earnings and revenue growth will bounce back.
- New investor – At times, a company’s share price could jump after a prominent new investor buys stock. Many participants view that as a stamp of approval for the shares.
- New product – At times, a company’s new product could push its stock higher. This is most common with pharmaceutical and technology companies.
- Earnings – Companies shares tend to react significantly when a company publishes its quarterly results.
There are other top catalysts that could help you confirm whether to buy or short a stock. Some of these are dividend hikes or cuts, a new investigation b federal officials, central bank decision, and technical arrangements. Therefore, always ensure that you have a catalyst before you enter a trade. If you are bullish about a stock, ask yourself why you expect it to rise.
Relative volume
Volume is an important thing that you should always look at before you confirm a trade. Volume refers to the amount of a financial asset that is being bought or sold. Ideally, more volume is usually a positive thing for traders.
For example, if you see a stock rising with limited volume, it could be a sign of a pump and dump. It could also signal that only a small number of people is pushing it higher.
Relative volume refers to the current volume compared to its historical volume. For example, if a stock has a volume of 1 million but its usual average is 200,000, it tells you that there is an overall interest in the company.
Fortunately, it is relatively easy to see the historic volume of stocks and other assets. The data is usually provided by most free platforms like Yahoo Finance, WeBull, and Barcharts. The chart below shows the relative volume of Facebook shares.
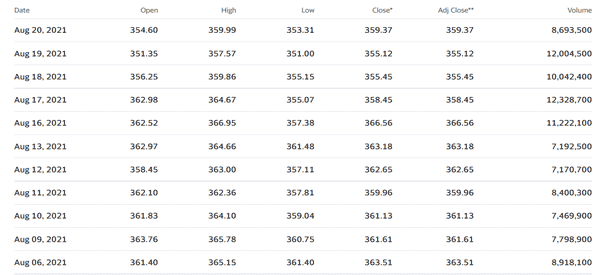
Therefore, before you buy a stock or any other asset, we recommend that you look at whether there is any volume to support the move. Still, it is important for you to know the type of volume and why it is happening.
At times, a higher volume in a stock could be because of insider activity or the accumulation by a large investor. You can simplify this by using the Relative Volume Indicator.
Where is wrong
The next confirmation you need to have before you place a trade is to think about what could go wrong. In other words, you should look at the next key stops if the trade does not go your way.
Ideally, some of these levels will be psychological points while others will be areas backed by the Fibonacci retracement. We recommend that you always place a stop-loss that ensures you don’t lose more than 3% of your account in a trade.
Technical levels
The next key confirmation to look at before you enter a trade is technical levels. As a trader, you likely use several technical indicators to confirm a trade. Some of the most popular indicators we recommend are moving averages, Volume Weighted Average Price (VWAP), and Bollinger Bands.
There are several ways of using these indicators. For example, some traders only buy when the short and longer moving averages have made a crossover.
Another popular indicator is known as the VWAP. Some traders only place a buy trade when the asset’s price is above the VWAP level. Those using the Bollinger Bands only open bullish trades when the price has crossed the middle line and is rising.
Therefore, in all these, you should ensure that your trade has been confirmed by key technical levels.
Identify target areas
Meanwhile, the final key confirmation level to look at when buying or selling a financial asset is the target area of the trade. Ideally, you need to always have the place where you are targeting your trade. This could be a previous high or a Fibonacci level. It could also be a place where you are targeting your profit at.
Having a price target is an important thing you should always have because it will act as your guide.
Final thoughts
There are several other things you should look at before you open a trade. For example, look at the time of day since it will determine whether a trade is worth it or not.
If you spot a catalyst right before the market closes, it might not be useful for you to buy or short the asset. Besides, as a day trader, you only have a very short duration to hold the trade.
Also, look at the financial and economic calendar to see whether there are more catalysts that lie ahead.
»Related: How to Start Trading Again After a Big Loss«
External Useful Resources
- Should You Wait for Trade Confirmation? Lazy Trader
