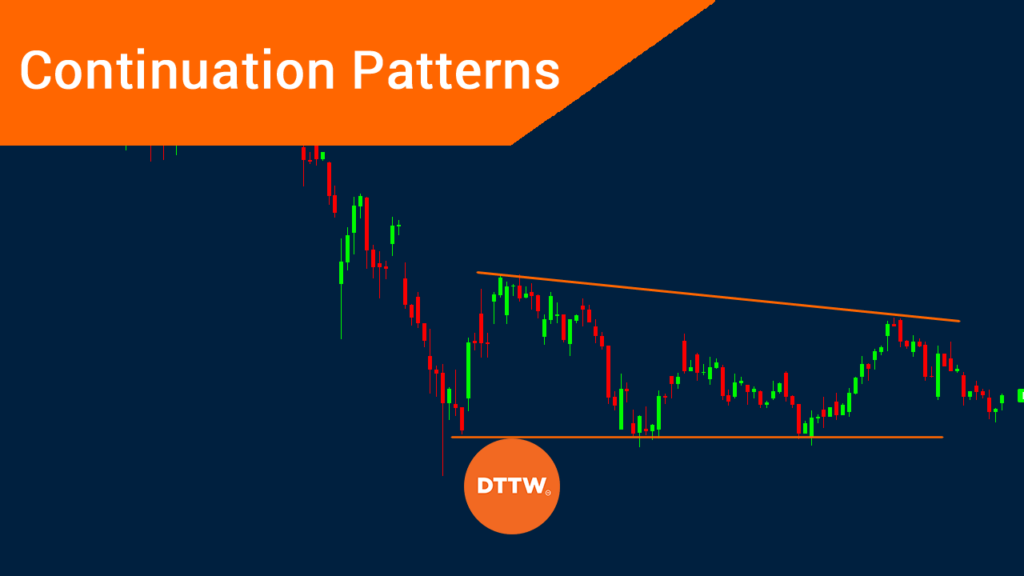
Continuation and reversal patterns are important concepts in the price action strategy. They are watched closely by day traders because they provide hints about whether a financial asset like an ETF, stock, or currency pair will continue moving in the original direction or start a new trend altogether.
In this article, we will look at some of the most important continuation patterns you can use in day trading.
What are continuation patterns?
Continuation is defined as the act or state of remaining in a particular position or direction. A continuation pattern refers to a situation where a financial asset forms a pattern that results in it moving in the original trend.
For example, after an asset forms a major rally, there is a time where it will consolidate. This happens as some traders exit in a bid to take profit. As they do this, some traders seek to enter new positions to take advantage of the original rally.
Let us look at some of the most popular continuation patterns you can use.
»How to trade reversal patterns?«
Ascending triangle pattern
There are three popular types of triangle patterns in the financial market. There are ascending, descending, and symmetrical triangle patterns. The first two are usually continuations while the final one is not because the price tends to break out in either direction.
An ascending triangle forms when a financial asset is moving in a bullish trend. It then hits a major resistance level and then forms a diagonal pattern. The diagonal line forms when the price drops and reaches a key support, rises back to the original resistance, drops again to slightly above the first support, and vice versa.
The ascending triangle is usually a bullish continuation pattern, meaning that its price breaks out to the upside.
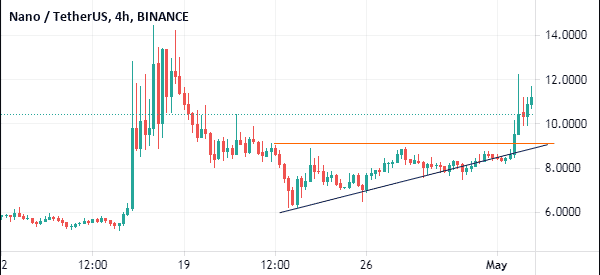
A good example of an ascending triangle is in the Nano/USDT pair below. As we can see, the pair found a strong resistance at $8.9105. It then made a series of declines that led to a formation of a diagonal pattern. Ultimately, the price broke out higher.
Descending triangle pattern
The descending triangle is the exact opposite of an ascending one. It forms when the financial asset is in a deep downward trend and it finds a major support. The price then forms a series of price actions that lead to a diagonal line. Like the ascending triangle pattern, this too is a form of continuation that leads to a bearish breakout.
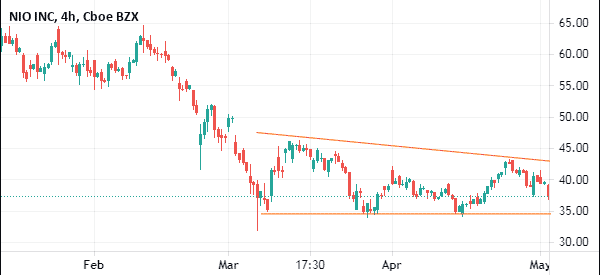
A good example of a descending triangle pattern is in the Nio stock below. The chart shows that the Nio shares declined to important support at $34. For days, the stock struggled to move below that level. It then rose to $46 and then dropped to the initial support. The shares then bounced back to $42.05, and then fell to the initial support.
At the time of writing, the shares are approaching the important support level. Therefore, while the shares have not yet made a bearish breakout, there is a possibility that they will.
There are several benefits of using the ascending and descending triangles in day trading. First, they are relatively easy to see and identify. Second, the patterns are relatively popular in the market. Finally, they tend to be highly accurate.
Bullish and bearish flag
Bullish and bearish flags are popular continuation patterns that traders encounter with them a few times. A bullish flag is a consolidation pattern in form of a rectangle that happens after an asset’s price suddenly jumps or after a major rally. The pattern is made up of a flag post, which is often a straight or a diagonal line, and then a consolidation pattern that looks like a flag.
This pattern happens when the asset’s price rally finds an initial resistance as some bears exit the market. As they do that, a consolidation pattern emerges in form of a triangle. In most cases, the price usually breaks out higher after a bullish flag pattern.
A bearish flag, on the other hand, is the opposite of a bullish flag. It happens after the asset’s price drops suddenly and then forms a consolidation pattern. In most cases, it will break out lower.
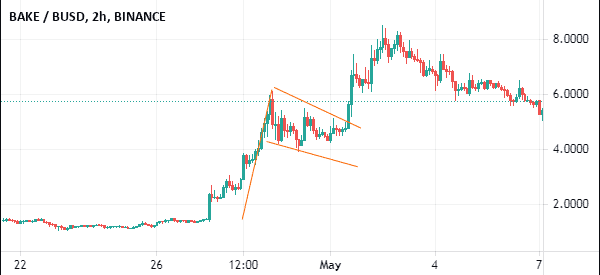
For example, in the chart below, we see that the BAKE/BUSD was in a bullish trend. It then formed a bullish flag pattern and then broke out higher.
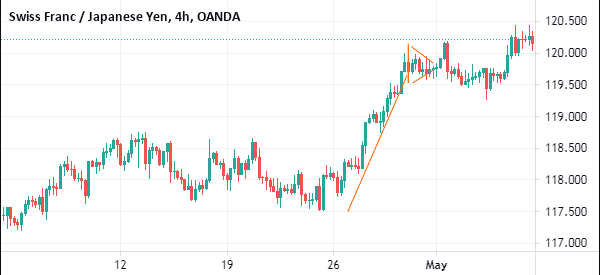
Bullish and Bearish Pennants
In addition to a bullish and bearish flag, there is also bullish and bearish pennants. Pennants differ from flags in that the upper and lower side is usually in form of a triangle pattern. The chart below shows a bullish pennant pattern in the CHF/JPY pair.
There are several benefits of using bullish and bearish flags and pennant patterns. First, these patterns are usually relatively easy to identify. Second, they are popular patterns that you will encounter often. Finally, they are relatively accurate.
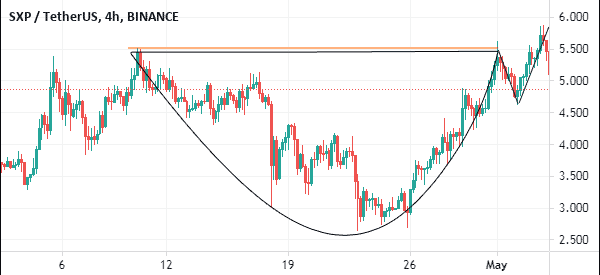
Cup and handle
The cup and handle is a popular continuation pattern that happens over a long period. Like the name suggests, it usually looks like a cup.
It forms when an asset’s price surges and then hits a major resistance. It then drops to a certain level and then starts moving upwards again to the initial resistance level. After hitting the resistance for the second time, the price then finds some resistance and either consolidate or retreats. In most cases, it will then break out higher.
The inverted cup and handle pattern is the opposite of this pattern. A good example of this pattern is shown below. The main challenge with this pattern is that it usually takes a long time to form.
Final thoughts
Continuation patterns are popular in the financial market. They are also essential patterns that can help you day trade without even using indicators and fundamental analysis methods. Most of the patterns we have looked are also highly accurate.
External Useful Resources
- What are all the reversal and continuation patterns do you know in chart reading – Quora
