Crossovers are an important part of day trading the forex, crypto, commodities, and the bond market. They are widely used to find entry and exit positions when both day trading and investing.
Crossovers are crucial among two common types of traders: reversals and trend-followers. A reversal-focused trader will often find opportunities when a certain crossover happens. Similarly, a trend-follower can find an opportunity when two moving averages cross each other.
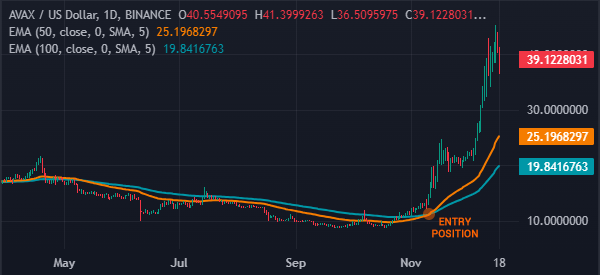
It is possible for a trader to be profitable by focusing on crossovers. For example, in the chart below, we see that the bullish breakout was confirmed when the 50-day and 100-day moving averages crossed each other.
What is a crossover?
A crossover, as the name suggests, is a period when two or more indicators cross each other. When these overlaps between two indicators happen, it tells you the direction that the price of the asset will move to.
It also shows you potential entry and exit positions for a trend trade. Importantly, a crossover can tell a trader whether an existing trend is about to end. In all, these situations are important because they help you to identify trading opportunities.
Crossovers can happen across all timeframes. In most cases, day traders focus on those that happen in extremely short-timeframes, including one-minute. Swing traders aim to identify medium-term overlaps while investors look at longer-term movements.
There are two main types of crossovers: bullish and bearish. A bullish crossover happens at a lower price when the price is about to move upwards. It points to a potential change of an asset’s price change from bearish to bullish.
A bearish crossover is the exact opposite of this. It happens when an asset that is in an uptrend changes direction and becomes bearish.
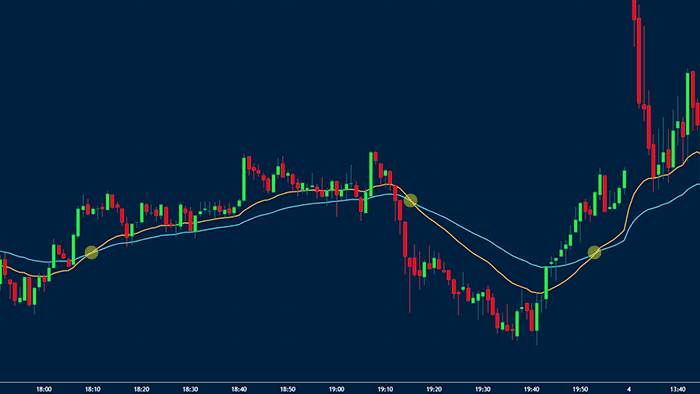
As you will see below, one of the best ways that this happens is when two short and long moving averages cross each other.
What crossovers mean in the stock market
The concept of crossovers is used widely in technical analysis, which is the idea of analyzing charts. In most cases, it is used with moving averages, the most popular technical indicators in the industry.
When these situations happen, it usually means that an existing trend is about to end and a new one about to happen. For example, if two indicators cross each other when an asset is in a downtrend, it means that a new bullish one is about to happen.
In other words, a crossover is a concept used in trading reversals. After a reversal happens, a new trend usually happens, which you can follow until the end.
Ways to identify a crossover
The easiest way: using MAs
The most popular crossovers are known as the golden cross and the death cross. The two happen when two moving averages cross and are therefore a signal to buy or sell.
A golden cross happens when a longer moving average – often a 200 period – and a shorter one crosses one another.
To starters, a moving average is an indicator that tracks the overall average of a price across a certain period. There are several types of averages, which include:
- simple moving average
- exponential moving average
- smoothed moving averages
- weighted moving average
among others.
Moving averages are trend-based indicators. They are used to identify when a trend is about to form and when it is about to wane. If you’d like to learn more about how to identify a trend early, take a look here.
Golden cross & death cross
While there are many ways of using the moving averages, crossovers are one of the best. In this case, the idea is to add two averages of different durations and identify when they meet each other.
In the golden cross and death cross, the most popular averages used are the 200-day and 50-day averages.
If the two crossover points upwards, they are usually a sign that bulls are winning and that the price will keep rising. Similarly, if they break out lower, it is a sign that a new downward trend is beginning.
While the 200-day and 50-day MAs are the most popular, most short-term traders come up with their preferred periods. The most common is a 14-day and 7-day moving average.
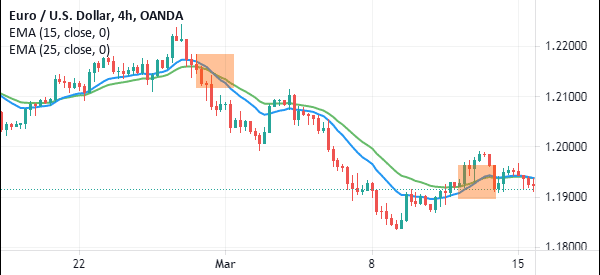
The chart below shows that the EUR/USD kept falling after the two moving averages made a crossover.
MACD
The moving average convergence and divergence (MACD) is an oscillator created using moving averages. It was developed by Gerald Appel more than 40 years ago and it has become one of the most popular indicators in the world.
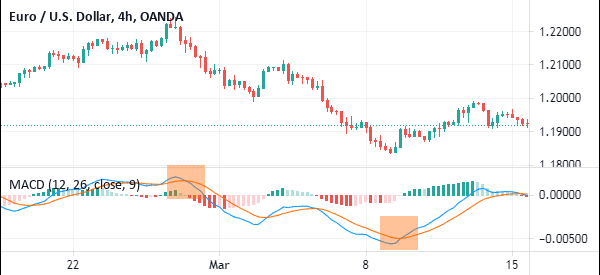
The MACD is derived by first subtracting the 12-day exponential moving average from the 26-day EMA. The signal line of the MACD is the 9-day moving average of the MACD line. The histogram, on the other hand, is the MACD line minus the signal line.
While the MACD can be used to identify overbought and oversold levels, the most popular strategy is to identify where the two lines make a crossover.
When they cross below the neutral line, it is usually a sign that the price is about to break out higher. On the other hand, when the two lines make a crossover above the neutral line, it is a sign of a bearish sign.
As mentioned, the foundation of the MACD is on the 12-day and 26-day moving average. However, you can adjust these periods to match your trading strategy.
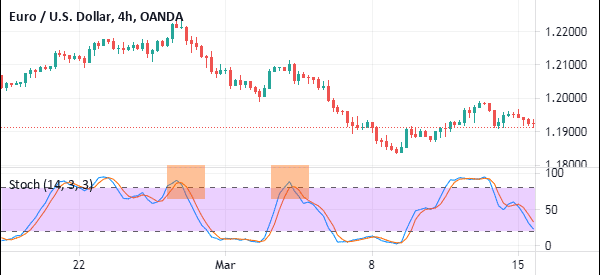
Stochastic oscillator
The Stochastic oscillator was developed by George Lane in the 1950s. It is one of the best-known oscillators in the market, with the others being the Relative Strength Index (RSI) and the Relative Vigor Index (RVI).
The Stochastic oscillator is a relatively difficult indicator to calculate. For one, you first need to calculate the %K, which is calculated by first subtracting the lowest low from the current close and then dividing it by the lowest low and highest low and multiplying the result by 100.
The %D is calculated by finding the 3-day simple moving average of the %K.
Using the stochastic oscillator is easy. Like all oscillators, it is used to identify overbought and oversold levels. When the two lines are below 25, it is said to be in the oversold zone. When they are above 75, it is said to be in the overbought zone.
The crossover of %K and %D
Still, the most popular trading strategy of using the stochastic oscillator is to identify the crossover of the %K and %D.
When it happens at the oversold zone, it is usually a sign that the price will rebound. Similarly, when it crosses over above the overbought zone, it is a sign that the price will start to drop.
The chart below shows a good example of the Stochastic oscillator.
Crossover trading strategies
There are a few trading strategies that you can use in day, swing, or position trading when two indicators intersect each other. Some of these strategies are:
Trend following
Trend following is a trading strategy that involves identifying an existing trend and then following it to the end. The idea is that an existing trend will continue until it meets an equal force in the opposite direction.
It is possible to use crossovers in trend-following. For example, after a golden cross happens, it usually leads to a new bullish trend, which you can follow. Similarly, a death cross is followed by a bearish trend, which you can short the asset.
After the crossover happens, there are two main ways of holding the trade. First, you can hold it as long as it is above the moving average. Second, you can maintain the trade as long as it is above an ascending trendline. Further, you can hold the trade as long as it is above the dots of the Parabolic SAR.
Check them in multiple timeframes
The other strategy for using crossovers is to look at the various timeframes just to confirm. In most cases, it is usually recommended to use at least three time frames in analysis. For a day trader, you can use the four-hour, hourly, and the 15-minute chart.
Alternatively, you can use the 1-hour, 30-minute, and the 5-minute charts. Using these charts is an ideal strategy that can help you identify crossovers.
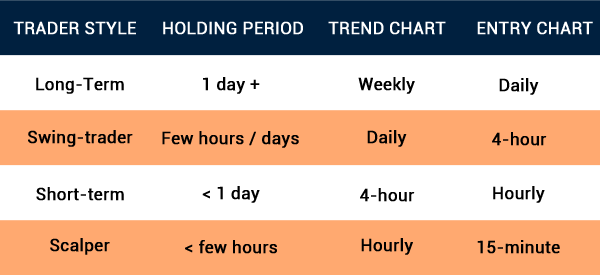
In this case, if you find them in the 15-minute chart, you can look at the hourly chart for confirmation.
Confirmation signals
The other strategy for using crossovers is for confirmation signals. If you are using price action analysis, there are several chart patterns like head and shoulders, double-top and triple-top, symmetrical triangle and wedge.
When these patterns happen, you can use crossover patterns like golden and death cross to confirm the moves.
Benefits of using crossovers
There are several benefits of using crossovers in the financial market. First, they are relatively easy to use tools in the market. For one, it is easy to combine the short and longer-term moving averages. Also, it is easy to implement the other three types of crossovers that we have looked at above.
Second, this approach can be used well in combination. For example, a crossover of the moving averages, stochastics, and MACD can be used to confirm when a reversal is about to happen.
Third, you can come up with a custom crossover trading strategy. Finally, you can easily automate the moving averages using a robot.
Common crossover mistakes to avoid
Like all trading strategies, there are some common mistakes that can lead to substantial losses. Some of these mistakes to avoid are:
- Over Reliance on crossovers – While crossovers work well, you should combine them with other tools and strategies.
- Ignoring market context – In addition to crossovers, you should also focus on other factors in the market like news and economic data.
- Not using risk management – There is the mistake of not using the risk management strategies mentioned above when using this strategy.
Risk management when using crossovers
Risk management is one of the most important parts of day trading. It refers to the concept of reducing risks while maximizing returns. Some of the most important risk management strategies to use are:
Using a stop loss
A stop-loss is a tool that stops your trade automatically when it reaches a certain point. For example, if you place a buy trade at $10, you can place a stop-loss at $8. In this case, if the bullish trade fails, the stop-loss will be triggered.
While a stop-loss is a good tool, you might consider using a trailing stop, which moves along with the asset. In the above example, if the price rises to $12 and then quickly drops to $8, your initial profits will be triggered.
Position sizing
The size of a trade plays an important role in the financial market. A higher trade size means that you will make more money if the trade goes on well. For example, if you buy 10 shares, your profit will be bigger than if you buy 5 stocks.
The risk of opening big trades is that it can lead to more losses. Therefore, always ensure that you are opening moderate trades to reduce your loss exposure.
Leverage
Leverage is a loan that a broker provides you with the goal of maximizing your profits. A higher leverage will lead to more profits but expose you to more risks.
Therefore, you should limit this leverage challenge by using a smaller one. While the profits will not be big, they will help you manage risks in the market.
Backtesting
The other risk management strategy to consider is known as backtesting. This is a process where you use historic data to gauge the performance of an asset. It is mostly used when you are using a robot or an algorithmic tool.
Most trading platforms like TradingView and MT4 and MT5 have their backtesting features. You can use these backtesting tools if you have created a crossover robot.
There are other risk management strategies to have in mind, including, not leaving your trades open overnight, cutting losses early, and diversification.
Final thoughts
Trading crossovers is a popular thing among forex, stocks, and commodity traders. It is a relatively easy process to use and is one of the most accurate. However, to succeed, you will need to practice for a while.
Also, you should try it well using your preferred parameters.
External Useful Resources
- Generating Trade Signals using Moving Average(MA) Crossover Strategy – Towards Data Science
