In the world of finance, trading has become one of the most lucrative and exciting areas to make profits. However, trading is a complex and risky activity that requires a solid understanding of the market and its various indicators.
One such indicator that has become increasingly popular is the stochastic oscillator, which is used to analyze a security’s potential price range.
In this article, We will explain what a stochastic oscillator is and how customized settings of this technical indicator could potentially influence on your trading achievements.
What Is a Stochastic Oscillator?
The stochastic oscillator is a momentum indicator that measures the level of a security’s closing price relative to its price range over a specified period.
The indicator consists of two lines: the %K line and the %D line. The %K line is the main line, and it represents the current closing price in relation to the high and low prices of a security over a specified period.
The %D line is a moving average of the %K line and helps to smooth out the indicator’s fluctuations.
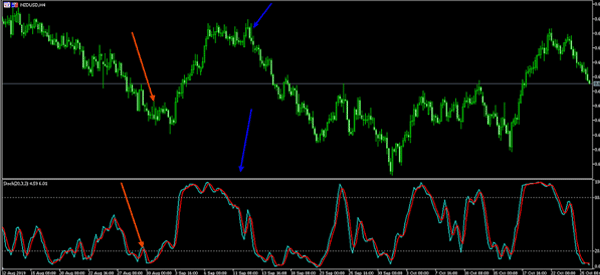
Traders use this technical indicator to identify potential buy and sell signals. When the %K line crosses above the %D line from below, it is considered a bullish signal, indicating that the security may be oversold and due for a price increase.
Conversely, when the %K line crosses below the %D line from above, it is considered a bearish signal, indicating that the security may be overbought and due for a price decrease.
Why Customize Stochastic Oscillator Settings?
The standard settings for the stochastic oscillator (which are 14 periods for the %K line and 3 periods for the %D line) are based on the default settings created by its creator, George Lane.
However, different securities have different price ranges, and using the same settings for all securities may not provide accurate results. By customizing the stochastic oscillator settings, traders can adapt the indicator to the particular security they are analyzing.
Customizing the settings can also help traders identify trends and market conditions that are not apparent with the standard settings.
For example, using shorter periods for the %K and %D lines can provide a more sensitive indicator that responds more quickly to changes in the security’s price.
Using longer periods for the %K and %D lines can provide a smoother indicator that is less sensitive to short-term fluctuations.
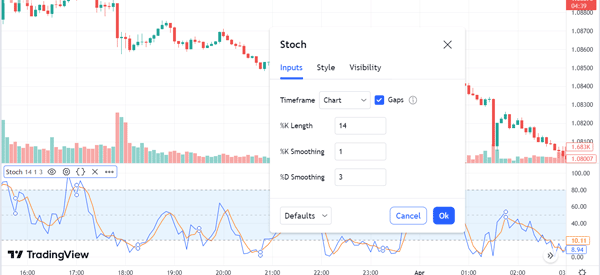
How to Customize Stochastic Oscillator Settings?
To customize the stochastic indicator settings, traders can adjust the number of periods for the %K and %D lines. The number of periods determines the length of time over which the indicator is calculated.
- Shorter periods will result in a more sensitive indicator that responds quickly to changes in the security’s price.
- Longer periods will result in a smoother indicator that is less sensitive to short-term fluctuations.
Traders can experiment with different settings to find the ones that work best for the particular security they are analyzing.
For example, if a security has a very narrow price range, using shorter periods may be more appropriate to capture any changes in the security’s price. On the other hand, if a security has a very wide price range, using longer periods may be more appropriate to smooth out the indicator’s fluctuations.
Related » Which is your Trading Style?
It is important to note that customizing the stochastic oscillator settings should be done in conjunction with other technical analysis tools and fundamental analysis.
Traders should also be aware that this technical analysis tool is not infallible and should be used as part of a broader trading strategy.
Examples of Customizing Stochastic Oscillator Settings
Let us consider two examples of how adjusting stochastic oscillator settings can improve the accuracy of the indicator.
Example 1: EUR/USD Forex Pair
When analyzing the EUR/USD forex pair, a shorter period for the %K line may be more appropriate. The EUR/USD pair is known for its short-term volatility, and using a shorter period can capture the price fluctuations accurately.
In this case, using a 7-period %K line and a 3-period %D line provides a more sensitive indicator that captures the short-term trends in the EUR/USD pair’s price movements.
Example 2: Bitcoin (BTC) Cryptocurrency
When analyzing Bitcoin, a longer period for the %K line may be more appropriate. Bitcoin is known for its high volatility, and using a longer period can smooth out the fluctuations and provide a better indicator of the longer-term trends in price movements.
In this case, using a 21-period %K line and a 3-period %D line provides a smoother indicator that captures the longer-term trends in Bitcoin’s price movements.
Summing Up
The stochastic oscillator is a powerful tool that can help traders analyze a security’s potential price range. However, the standard settings may not always be appropriate for every security, and customizing the settings can unlock the indicator’s full potential.
By experimenting with different settings and adapting the indicator to the particular security being analyzed, traders can make more informed trading decisions and improve their chances of success.
Moreover, it is crucial to use a stochastic oscillator in conjunction with other technical analysis tools and fundamental analysis as part of a broader trading strategy and risk management plan.
