One of the basic tips to trading successfully is to be familiar with the current market news. Analyzing the acquired information and subsequently making a concrete decision requires effective tools like the price action trading strategies.
With these strategies, a trader is able to use the recorded price variations to predict market movements. The components of technical analysis that are linked to price action trading include:
- high and low swings
- trend lines
- charts
- price band
How to Execute the Price Action Trading?
There are two main ways that a trader can execute price action trading. To start with, you can use simple patterns to observe the market. These simple means include price bars, trend lines, and breakouts.
On the other hand, you can go for a more comprehensive approach that combines volatility with channels and candlesticks.
Previously, we have discussed several price action strategies including cup and handle, bullish and bearish pennants, shooting star, hammer candlestick, triangles, as well as bullish and bearish flags.
In this article, our focus will be on the dark cloud cover.
What is the Dark Cloud Cover?
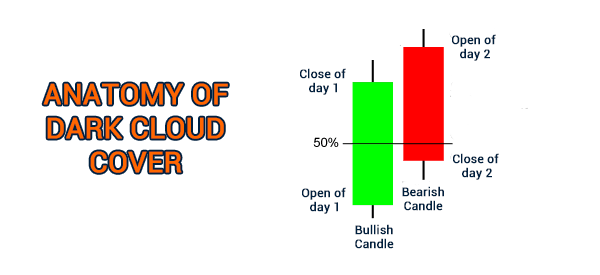
The dark cloud cover is a bearish reversal candlestick pattern whose presence indicates a probable reversal to a downward trend. It usually comes about at the peak of an uptrend. It starts with a bullish (green) candle followed by a bearish (red) candle that yields a new high.
After the new high, the market is expected to close lower than the bullish candle’s midway point. Its appearance is as shown below.
Distinctive Features
The distinctive features of the dark cloud cover are:
- Its length is shorter compared to the preceding candlestick
- Its bearish body forms the largest part of the candlestick
- The close occurs below the preceding candlestick’s halfway mark
In a chart, it would appear as shown below.
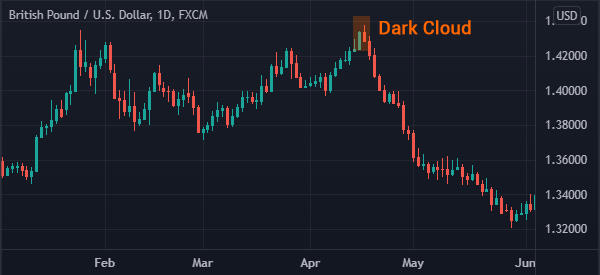
How to identify a dark cloud cover
The dark cloud cover is not a relatively popular candlestick pattern. Indeed, in our experience, you will not experience it in most of your trading sessions. Still, when it happens, it is usually a good sign that a financial asset will reverse soon.
To identify a dark cloud cover, you first need to ensure that a financial asset is in an upward trend. Next, look at the size of the bullish candles to see whether there are signs that the bullish momentum is slowing down. You can also look at technical indicators like the Relative Strength Index (RSI) and MACD for any signs of a bearish divergence.
Next, look for a situation where a big red or bearish candlestick is formed. In most cases, this happens when an asset price opens up and then retreats. As such, the pattern is mostly popular among stocks, which close every evening and then open the following day.
Finally, look for a confirmation of the bearish trend.
Dark Cloud vs Engulfing Candle
One can confuse the dark cloud cover with the Bearish engulfing candle. On the one hand, they both signal a possible trend reversal.
However, the first one tends to offer better entry levels. A bearish engulfing candlestick pattern happens at the end of a bullish trend. It happens when there is a relatively small bullish candlestick that is completely engulfed by a bigger bearish candlestick. In most cases, the engulfing pattern will often lead to a reversal.
This is largely because the bearish candle of the cloud has a higher close compared to that of the bearish engulfing candle.
Dark Cloud Cover vs piercing pattern
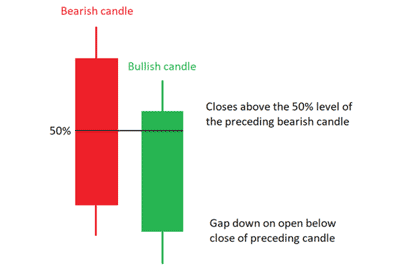
The dark cloud cover is also often confused with the piercing pattern. As shown below, the piercing pattern starts with a big bearish candle and is then followed by a bullish (green) candlestick. In an engulfing pattern, the second candlestick usually surrounds the first one completely.
In a piercing line pattern, the second candle usually covers just a small part of the bearish candle. Its lower shadow and small section of the body is usually below the lower shadow of the first bearish candlestick.
The dark cloud cover and piercing line candlestick pattern is usually a sign of reversal. Another difference the two is that it usually forms in a bearish trend.
How to Trade the Dark Cloud Cover Candlestick Pattern
Traders can use this candlestick pattern to trade the usual trending markets as well as ranging markets.
When trading this pattern, it advisable to place your stop loss order above the preceding swing high. Since the trade is a probable start of an extended downtrend, one can set several target levels.
The first target level can be at key levels. Alternatively, you can place the target level at the recent areas of resistance/support.
› Why Stop Loss Orders are important
Advantages & Drawbacks of the Dark Cloud Cover
Here are some of the key benefits of using the dark cloud cover.
- Appealing entry levels since the pattern occurs at the onset of the probable downtrend.
- Traders, including the beginners, can identify it with ease.
- Has a better risk-to-reward ratio than the bearish engulfing pattern.
Similar to some of the candlestick patterns that we discussed in previous articles, traders cannot trade it based solely on its formation. As such, it is essential to include indicators as well as technical analysis.
The occurrence of the pattern within the existing trend is a crucial determinant. It has to appear at the peak of an uptrend.
Final Thoughts
Similar to the price action trading strategies that we have discussed in previous articles, the dark cloud cover is a useful trading tool that assists traders in analyzing the market.
The resultant information is helpful in making concrete decisions on the best time to open a position. However, it is important to include indicators and technical analysis for effective trading.
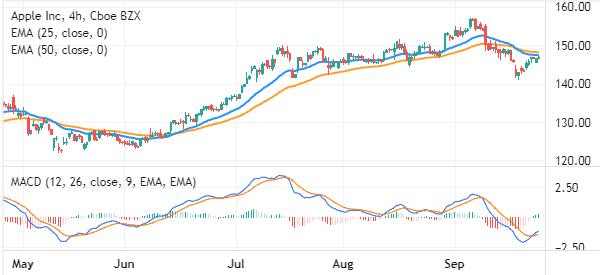
For example, in the chart below, we see that the Apple stock has been in a bullish trend. After a while, the stock formed a dark cloud cover and started moving in a bearish trend. Along the way, it moved below the 25-day and 50-day moving averages while the MACD continued to drop. Therefore, this is a sign that the bearish trend will continue.
External Useful Resources
- Definition and Examples – Investopedia
- What is dark cloud pattern in stock market? – Quora
