The concept of divergence has always been popular in the financial market. According to the popular Merriam-Webster dictionary, one definition of divergence is the process of moving away from the course or standard.
In trading, it refers to a situation when the price of an asset moves in the opposite direction to the indicator.
In this article, you will learn what a divergent is, how to spot one, types of divergences, and the rules you need to follow when using the strategy.
What is a divergence in trading?
Divergence can be seen in different ways in the financial market. For example, when using technical indicators, it can be defined as a period when the price of an asset is moving in one direction while indicators are guiding for the opposite to happen.
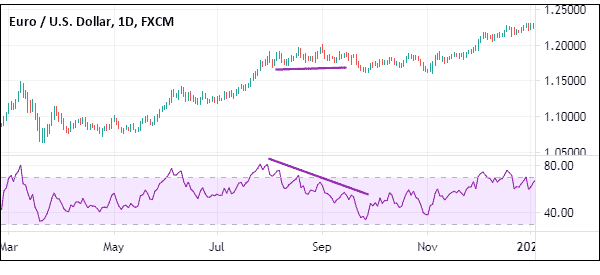
For example, a currency pair may be rising even as the Relative Strength Index (RSI) starts to decline from its extreme overbought levels. In most cases, when this happens, it is usually a signal that the original trend of an asset is starting to wane.
In the chart below, we see that the Relative Strength Index is falling even as the EUR/USD pair holds steady.
From the fundamental perspective, divergence is viewed as a period when the shares of a company are not in line with its intrinsic data. For example, the stock of a company may continue dropping even after reporting relatively strong economic numbers.
A good example is what happened to Intel in 2020. The stock cratered by more than 20% even after the firm continued to beat analysts forecasts.
Types of divergences
Broadly, there are two main types of divergences in trading:
- Bullish divergence
For starters, a bull is a trader or investor who hopes that the price of an asset will continue rising. A bullish divergence, therefore, happens when the price of an asset is falling even as one or more indicators start to signal a potential upward trend.
This divergence can happen in all types of assets, including forex, shares, and commodities. The chart below is a good example of a bullish divergence.
- Bearish divergence
A bearish divergence is the exact opposite of a bullish divergence. It happens when the price of an asset continues to fall even as the indicator starts to rise.
How accurate are divergence patterns?
Divergence patterns have a degree of accuracy. However, unlike other trading strategies like trend following, crossovers, and breakouts, divergences tend to be the least accurate.
In many cases, divergences can lead to false signals. Also, and most importantly, they take a longer time to form, which is a limitation.
Therefore, we recommend trading divergences sparingly since they also tend to have false signals numerous times.
How to trade divergences
In all fairness, trading divergences is a relatively difficult thing, especially for new traders. That’s because divergences don’t provide an initial signal of when to buy or when to sell.
Still, you can use several indicator-specific strategies to trade these divergences.
Trading divergences using the MACD
The Moving Average Convergence and Divergence (MACD) is one of the popular indicators used to show divergences in the market. The MACD is derived by subtracting a shorter moving average period from a longer one.
The most popular periods are the 26-day and 12-day moving averages. The signal line is usually the 9-day moving average. In other words, the MACD converts the normal moving averages into an oscillator.
Ideally, trading signals in MACD happen when the two lines make a crossover. If it happens below the neutral line, it is usually a bullish signal. Also, if it happens above the neutral line, it is usually a bearish signal.
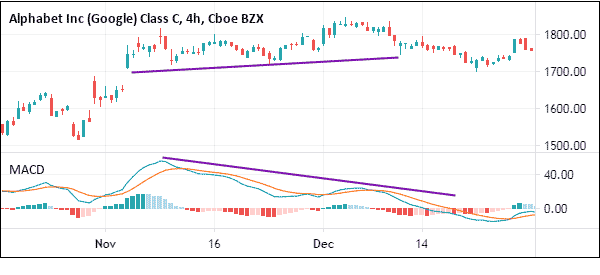
A bullish divergence in MACD happens when the price of an asset forms a lower low while the MACD forms a higher low. In this case, the lower low will affirm the current trend but the higher low in the indicator will signal a loss of strength.
Similarly, a bearish divergence forms when the price of an asset forms a higher high while the MACD forms a lower high. The chart below shows a bearish divergence on the Alphabet stock.
Using the RSI to trade divergences
Another approach of trading divergencies is using the Relative Strength Indicator (RSI). For starters, this indicator is one of the most popular indicators in the world today. It is typically used to identify overbought and oversold levels.
The indicator is calculated by first adding the gains and losses in a certain period and then finding the average gains and losses.
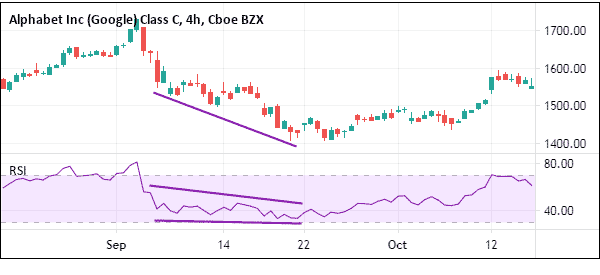
In most cases, a buy signal emerges when the index falls to below 30, which is the oversold level while a sell signal emerges when the RSI is above 70. Therefore, a divergence emerges when the RSI is rising while the price is falling, and vice versa.
The chart below shows a divergence that formed on the GOOG chart.
Identifying divergences using Stochastic oscillator
Another approach of identifying divergences is using the stochastic oscillator. For starters, the stochastic oscillator is also a popular two-lined indicator that identifies overbought and oversold situations.
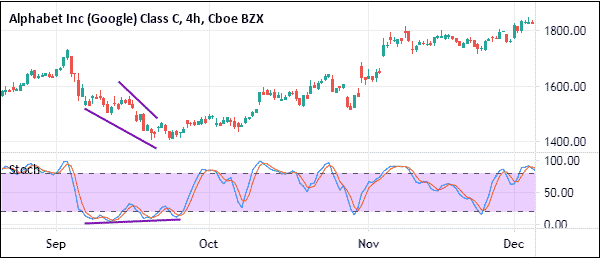
A bullish trend emerges when the two lines make a crossover below the lower line and continue rising. The vice versa is also true.
The chart below shows a bullish divergence on the GOOG chart. As you can see, while the share price is dropping, the two lines of the Stochastic oscillator are rising.
There are other popular strategies of trading divergences. Some of the other popular indicators you can use are momentum, the relative vigor index, and the divergence indicator that is in MetaTrader.
How to confirm divergences
There are numerous approaches to confirm divergences in the market. First, one of the best ways is to use other trend indicators like moving averages, Bollinger Bands, and Ichimoku Kinko Hyo.
In this case, if a divergence pattern is confirmed, you can use a golden cross or a death cross to confirm the move. A golden cross forms when fast and slow moving averages make a crossover.
The other approach is to use charting tools like Andrews Pitchfork and Fibonacci Retracement. In case of a bullish divergence, you can confirm the reversal when it moves above the 50% Fibonacci Retracement level.
Further, you can combine divergences with chart patterns like head and shoulders, rising and falling wedges, double-top, and double-bottoms. In some cases, a divergence is usually accompanied by one of these patterns.
Finally, volume is an important part of using divergences well. The idea is that a strong market move should be supported by a high volume. As such, the reversal should happen in a period when the flow of volume is supportive.
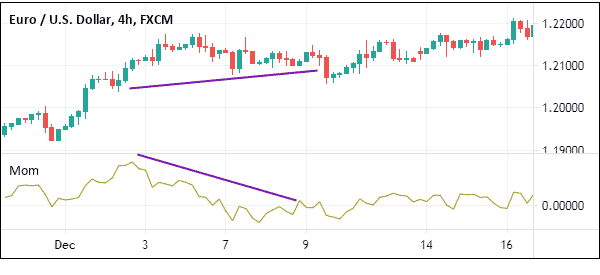
The relation between momentum and divergence
Momentum is an important concept in the financial market. It is defined as the rate of acceleration of an asset’s price or the speed of its changing.
In most cases, an asset in a strong rally is said to be having substantial momentum. As such, many traders buy or short and then follow the trend until it ends.
A divergence tends to happen when the trend or the momentum is fading. If an asset is in a strong rally, the divergence pattern happens when the trend is starting to fade.
Pros and cons of divergences
Pros
- Divergences are a contrarian approach to analyzing stocks and other assets. This means that you can find hidden opportunities in the market.
- When used well, divergences can be accurate trading strategies.
- Finally, you can find divergences using numerous technical indicators like the Relative Strength Index (RSI) and Stochastic Oscillator.
Cons
- Divergences take a long time to form.
- They can lead to false signals in the market.
Final thoughts
Trading divergences is one of the many trading strategies that professional traders use to make money. Indeed, it is a widely-used approach, especially among the experienced Wall Street titans.
All you need to do to trade it well is to identify the indicators you will use, understand them, and then practice using a demo account.
External Useful Resources
- Why is Experience in Divergence Trading a Must? – Quantisti
