Traders use multiple strategies to trade in the financial market. Identifying patterns is one of the most common strategies in Day Trading. And using Support and Resistance will give you many advantages!
In other articles, we have looked at concepts like technical analysis and fundamental analysis. Another common strategy used by traders is price action, which involves exactly this, look at charts and identify patterns.
And guess what’s a common feature in technical analysis and price action? Yeah, the use of support and resistance. In this article, we will look at what this method is and how you can use it in the market.
What is Support and Resistance?
Traders in the financial market observe patterns to predict what will happen in future (and there are many patterns that they observe!). For example, there are candlestick patterns like evening and morning star and Doji that they use to predict what will happen.
Support and resistance are levels where a financial asset finds it difficult to pass.
A support is a level at which demand is said to be so strong such that it prevents a price from going below. It can be viewed as a floor where a currency or a financial asset struggles to pass below.
The logic behind this is simple: When the price of an asset is declining, it means that buyers become more inclined to buy and sellers more inclined to sell. When the price reaches the support level, it is thought that demand will overcome supply.
A resistance level is the opposite of a support. This is where selling is said to be very strong to prevent the price from moving higher. As the price climbs towards the resistance, it is thought that sellers become more inclined to sell and buyers become less inclined to buy.
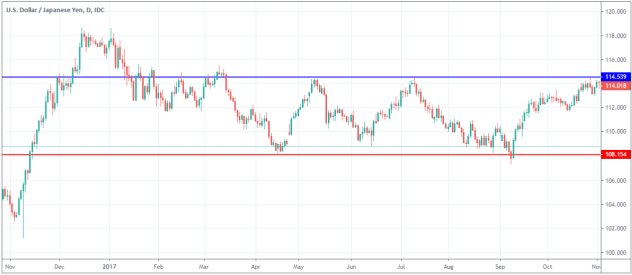
A resistance level is thought to be a ceiling. The chart below shows a good example of a support (red) and supply (blue) on the USD/JPY pair.
Why support and resistance are important
Support and resistance levels are so important to both investors and traders because they identify areas of psychological relevance. As shown above, a support level is a price where an asset fails to move below while a resistance is where it struggles to move above. Here are some of the other importance of support and resistance.
First, it helps to identify areas of potential breakouts and breakdowns. The general view is that an asset will continue rising if it moves above a certain resistance level and vice versa.
Second, these levels help you to find areas to place your stop-loss and take-profit. A stop-loss is a price where a trader wants to make the maximum loss while a take-profit is the profit target.
Third, support and resistance levels can help you understand the overall movement of an asset. And finally, they can help you to validate or invalidate a trend.
How to Draw S&R Levels
There are several approaches to drawing support and resistance levels. The most basic approach is the one shown above. You simply draw a line that connects high and low levels. These levels can be drawn horizontally (as shown above) or diagonally.
Another approach is to look at psychological levels (and we all know how much psychology affects traders). These are levels that have a significant importance to traders.
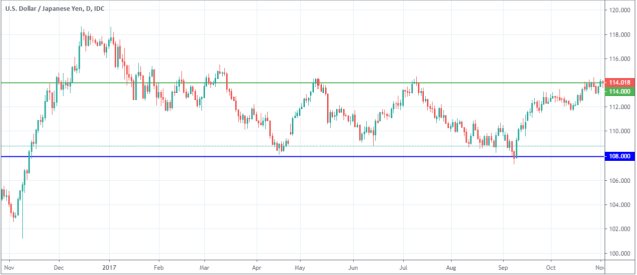
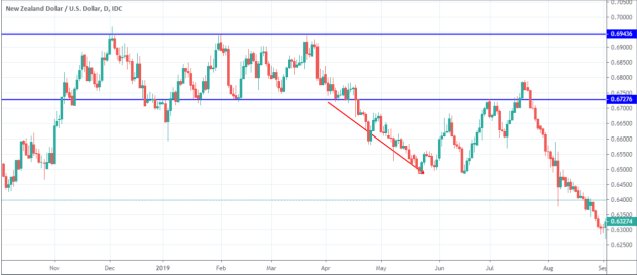
For example, traders love levels that have round numbers. On the chart below, support and resistance levels appear at 108 and 114 respectively.
Swing high and swing lows
The other important concept of drawing support and resistance levels is identifying higher and lower swings.
These swings are identified by the higher and lower wicks of the candlesticks. A good example of those swings is shown in the chart below.
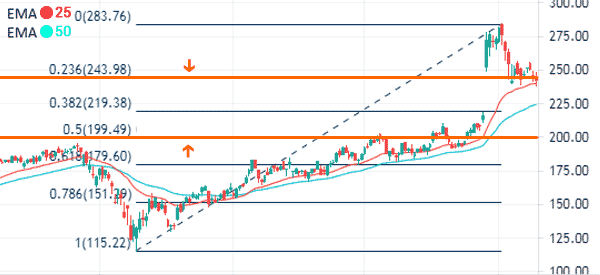
Using Fibonacci retracement
Another approach of drawing support and resistance levels is to use the Fibonacci retracement tool. The tool is simply drawn by connecting the highest and lowest levels of an asset. After connecting these points, the support and resistance levels will be the key levels of the retracement.
For example, on the Salesforce stock below, we have identified the key levels of support and resistance. If the price moves below the support at $199, the next key level to watch will be the 61.8% retracement at $180.
Psychological numbers
Finally, another way of determining support and resistance is to use psychological numbers. For example, if a stock has rallied from $150 to $180, the next key resistance level will be $190 and $200.
These numbers are usually strong levels because of how memorable they are. Also, many traders are known to place their take-profits and stop-losses there.
Day Trading With Support and Resistance
There are several methods of using S&R. The best way is to trade using a channel. A good example is shown on the previous charts. The idea is to buy when the asset hits the support level and short when it hits the resistance level.
This method works very well. However, you need to be careful of a breakout. A breakout happens when the price moves past the support and resistance and starts moving higher.
When it happens on a support, it means that bears have prevailed. This does not mean that the price will continue moving in the direction of the breakout.
In some cases, it may reverse, in what is known as a false breakout. The chart below shows when a breakout happens.
Trend analysis using S&R
Support and resistance levels are useful in trend analysis. This works in a relatively simple way. When an asset is moving in an uptrend, there are levels where traders focus on.
These levels can be said to be support and resistance. In this case, when an asset moves above a resistance, it sends a sign that the trend will continue.
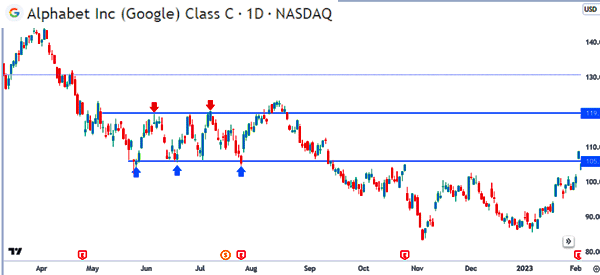
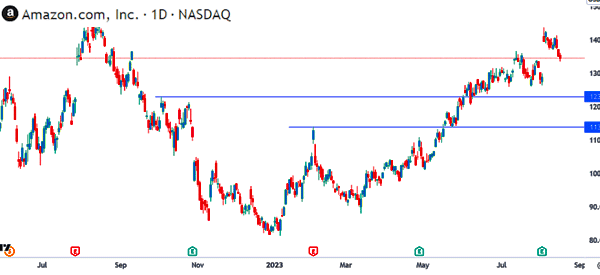
For example, in the chart below, we see that the stock is moving in an uptrend. The bullish trend was confirmed when the price moved above the resistance levels at $113.94 and $123.04.
Bounce and break strategy
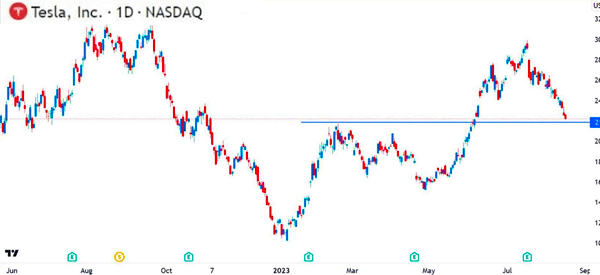
Another approach is known as a bounce and break strategy, also known as a break and retest. This is a situation where an asset moves above a resistance or below a support and then retests it. When this happens, it is usually a sign that the trend will continue.
For example, in the chart below, we see that Tesla share price made a bullish breakout above $218 and then soared to $300. It then retreated and is approaching the previous support.
Therefore, the shares will likely resume the bullish trend after retesting that support.
Support and Resistance Strategies
Stops
Another strategy is to use support and resistance levels as a way of putting a stop loss and a take profit. A stop loss is a location where you want to take the maximum loss.
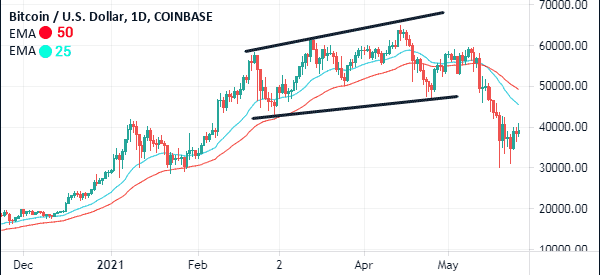
A take-profit and stop-loss are mandatory tools for any serious day trader. A good example is what happened in the crypto industry in May 2021.
After surging to an all-time high, the prices of most cryptocurrencies made a sharp dive. In this case, traders who lacked a take-profit and a stop-loss made substantial losses.
Using pending orders
Another popular trading strategy when using support and resistance is to use a pending order. For starters, a pending order is a situation where you direct a broker to buy or sell an asset at a future point.
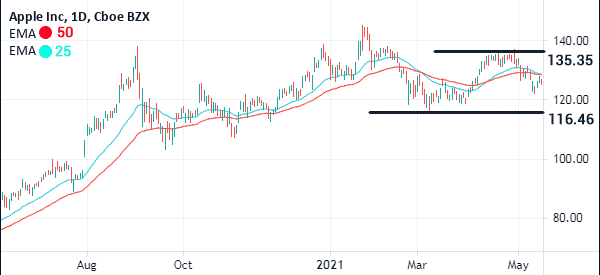
For example, in the chart below, we see that the Apple stock has formed a strong support at $116 and a resistance at $135. At this stage, it is difficult to know whether the stock price will fall below the support or rise above the resistance.
In this case, you could place a buy stop trade at $137 and a sell-stop at $114. In this case, if it breaks higher, the stock will move to $137 and a new trade will be opened. Similarly, if it falls below $116, a short order will be traded.
Therefore, in this case, you have used support and resistance levels to find good entry points. Pending orders are also important because they are only opened when the price tests them.
Use confirmation indicator to support S&R thesis
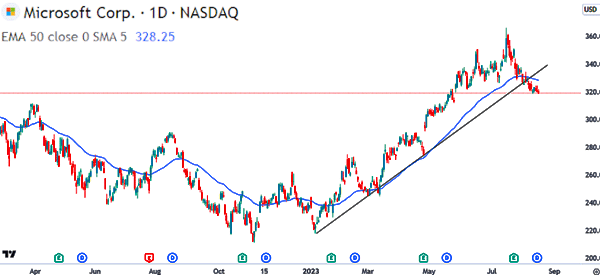
Another support and resistance strategy is to use confirmation indicators to support the thesis. The most popular indicators to use are moving averages, ichimoku kinko hyo, and Bollinger Bands.
For example, in the chart below, we see that the Nasdaq 100 index has moved below the 50-day moving average and the ascending support level. This is a sign that bears are prevailing and that the price will continue falling.
External Useful resoursces
- How to Identify Support and Resistance Levels on a Stock Chart – SwingTradeStocks
- Stop Trading S&R The Wrong Way – Mark Soberman on Medium
