Technical analysis is one of the two main types of studying and understanding the market. The other method is known as fundamental analysis. These are the two methods that Wall Street pros use to beat the market.
Fundamental analysis is a method that relies on news and economic data to determine the direction of an asset. Technical analysis, as we have written before, is a method that uses various indicators to determine the direction of an asset.
These indicators include the likes of moving averages, average directional index, and the relative strength index (RSI).
In this article, we will look at DeMarker indicator and how you can use it to beat the market.
What is the DeMarker Indicator?
The DeMarker indicator is a free indicator that is available in most charting software like MT4 and PPro8. The indicator is one of the 30+ indicators that were developed by Tom DeMark. Other indicators in the family are Differential, Channel 1, 2, and 3, Double Point, Camouflage, and Arc among others.
Tom is one of the best-known traders of our time, and his eponymous consulting firm is used by many Wall Street professionals.
The DeMarker indicator is found on the oscillators section of most trading platforms. It looks like other oscillators like the relative strength index and the commodity channels index.
The indicator is derived by comparing the maximum and minimum prices that have been achieved in a certain period with those achieved in another period. By making this comparison, the indicator attempts to assess the directional bias of the market.
As it is doing this, the indicator helps the users identify the oversold and overbought levels.
How to calculate it?
As we have written before, calculating how an indicator is calculated is not mandatory. We know many successful Wall Street traders who can’t explain how simple indicators like moving averages are calculated.
The DeMark indicator does not focus on closing levels as the RSI does. Instead, it focuses on intra-period highs and lows.
It looks at the current bar of the asset and compares it with the previous bar. If the strength of the high and low is less extreme in the previous bar, the indicator records a zero.
The indicator then looks at this range over a certain period. In most charts, the indicator uses a period of 14 but this can be changed.
Demarker Formula
Below is the formula of the DeMarker indicator:
| DEM = SMA(DeMMAX) [SMA(DeMMAX) + SMA(DeMMIN)] |
In this equation, DeMMAX is a relatively easy number to get. It is calculated by looking at the high values in a given period. In this, if the current high figure is smaller than the previous high, it is noted as zero.
If it is greater than the previous high point, you get the difference. This is the DEMMAX.
How to Use the DeMarker Indicator
Using the DeMarker indicator is relatively easy.
First, you need to look at a chart that is trending. Like most other indicators, it is not recommended to use it in ranging markets.
Second, you need to check the period that has been applied. Looking at this period is important because it affects your trading strategy. You should test the period that works in line with the strategy.
By default, most platforms add the period as 13. But you can test one to see the one that fits your strategy. You can also change the colour of the indicator.
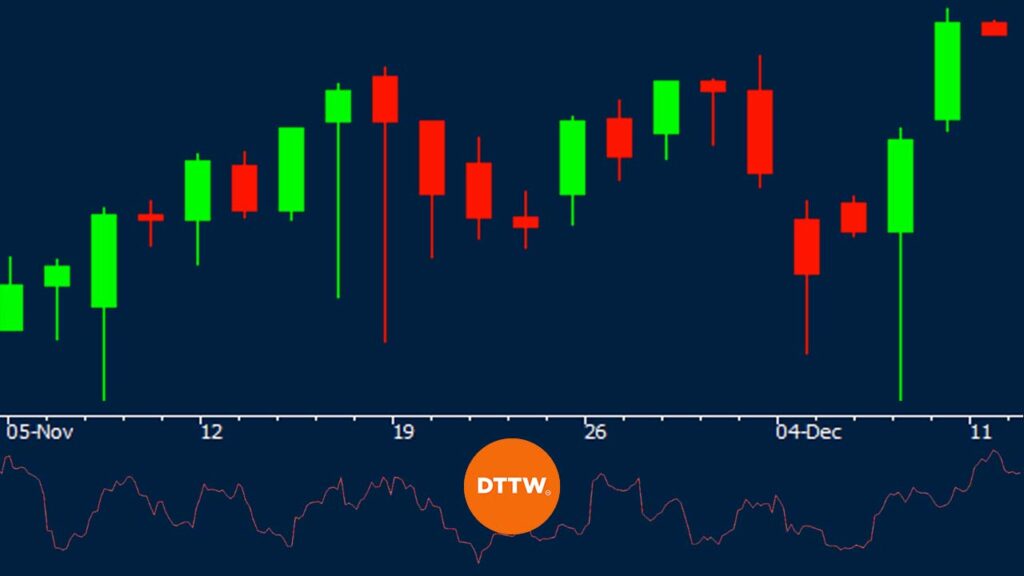
Third, you need to apply the indicator and watch how it is behaving. A level below 0.3 is said to be oversold while a DeMarker above 0.70 is said to be overbought as shown below.
An overbought is usually a sign that the price may start coming down while an oversold level is usually a sign that the price may start moving upwards.
However, as you can see on the chart above, this is usually not the case all the time. A pair may continue declining even after the DeMarker indicator reaches the oversold level and vice versa.
Finding overbought and oversold levels is the most common approaches of using the DeMarker indicator. A better way of using this strategy is to use it as a way of validating other indicators like the Bollinger Bands and Moving Averages.
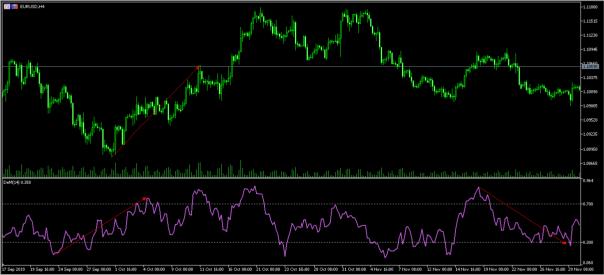
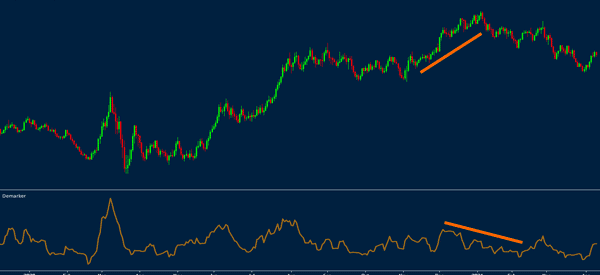
Using the DeMarker to find divergencies
Like all oscillators, advanced day traders use the DeMarker to find divergencies. A divergence is a situation where the price of an asset is acting different from the oscillators.
These situations tend to be rare. Also, it is always recommended that you combine several oscillators to confirm the divergence.
In the chart below, we see that while the EUR/USD price is rising, the DeMarker indicator is generally falling. Ultimately, the asset then breaks out lower.
Summary
The DeMarker indicator is not popular among day traders but most professional trades use it. It is an easy-to-use indicator that you can use across other assets like stocks, currencies, and cryptocurrencies.
External Useful Resources
- DeMarker indicator: an effective cure for risks or why you should trust the classics – Forextester
- DM indicators ideas – Tradingview
