Day trading is one of the most interesting and unique things you can do. It is interesting because of everything that happens in the market every day. It is unique because of how traders from around the world make money.
As we have written before, there are those traders who believe in fundamental analysis. There are others who believe in technical analysis.
The technical analysis field is so wide and there are hundreds of indicators you can use. In this article, we will look at the Detrended Price Oscillator (DPO), one of the best solutions if you want to remove the noise of the price movements.
This is an indicator that many traders don’t know because it is not found as a default in some of the popular charting software.
What is the DPO indicator?
The term detrended is derived from the term detrend. It is the opposite of using a trend. Detrending is a concept that is used because some cycle behavior is usually dependent on the direction of the next cycle.
The reason for detrending is to remove the noise that is brought about by price movements. The process of detrending is relatively simple: You simply divide the present price of an asset by the moving average of the price.
The Detrended Price Oscillator is calculated using the formula below:
| Price (x/2 + 1) |
where x is the number of periods that are used.
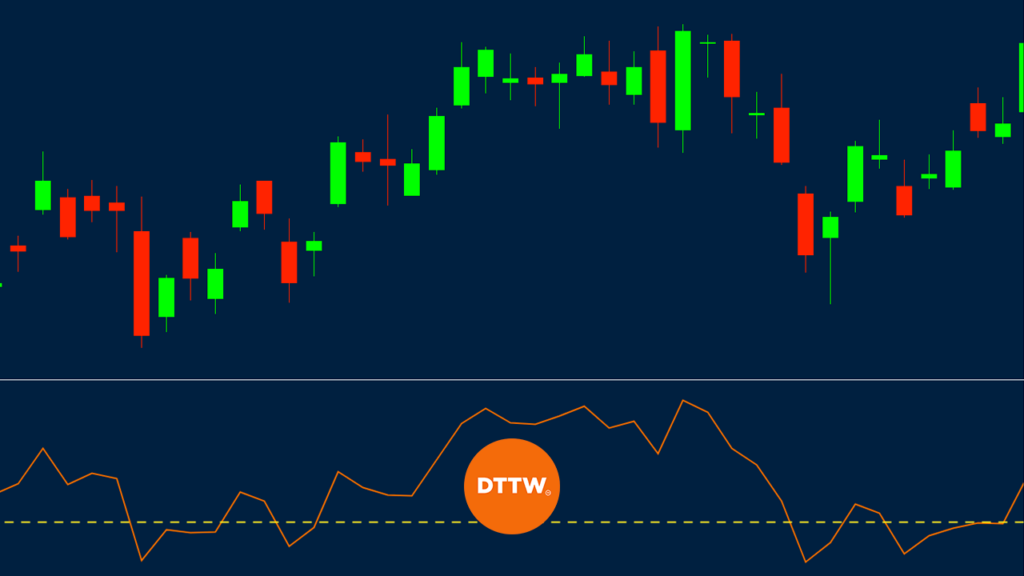
When the Detrended Price Oscillator is applied on a chart, it usually appears as a line that moves up and down.
It usually ranges between -0.05 and +0.05.
What does the detrended price oscillator tell you?
To understand what the DPO oscillator is, we first need to know what a detrend is. It refers to the process of removing the effects of long-term trends from a data set to show the differences in values from the trend. Therefore, it helps to show the cyclical and other patterns to be identified.
In this case, the Detrended Price Oscillator achieves this by comparing its price with the Simple Moving Average (SMA) to a historical price that is close to the middle of the look-back period. By doing this, a trader can anticipate the next price cycle of the asset.
In most cases, DPO users do this by drawing vertical lines at the peaks and troughs and then count the period that happened in that phase. If the gap is 5 days apart, then you can anticipate the next price movement.
The other important element is that a trader can use the distance between the trough and peak to estimate the duration of a long trade. Also, the distance between the peak and trough can be used to estimate the length of a short trade.
Best detrended price oscillator settings
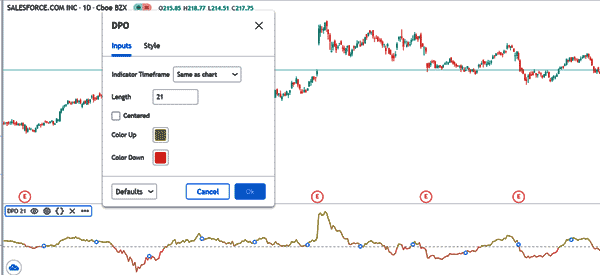
There are three main things that a trader using the Detrended Price Oscillator can change. The most important is the period section. In most trading platforms, the default period used is 21. However, like all technical indicators, this is a setting that you can change to match your trading strategy.
The second important setting you should watch is the indicator timeframe. In most cases, you should use an indicator that is the same as the chart.
For example, if you are using the daily chart, you should let the indicator be based on the daily chart. You simply don’t want a situation where you are using a daily chart and a DPO of an hourly chart.
Finally, you can change the color of the line. By default, the Detrended indicator has a green and red color but you can change the two. The chart below shows the DPO indicator applied on the Salesforce chart.
Detrended Price Oscillator trading strategies
As we have written before, most traders use oscillators to identify the overbought and oversold levels. A level is said to be overbought when the indicator moves so much higher.
In the case of the Detrended Price Oscillator, the overbought level can be said to be above 0.05. It is usually said to be oversold when it moved so much lower.
However, as we will explain, there are several ways of using the Detrended pattern.
Using the DPO’s Zero Line
One of the most effective ways of using the DPO indicator is to use the zero line. This is the line that appears in the middle.
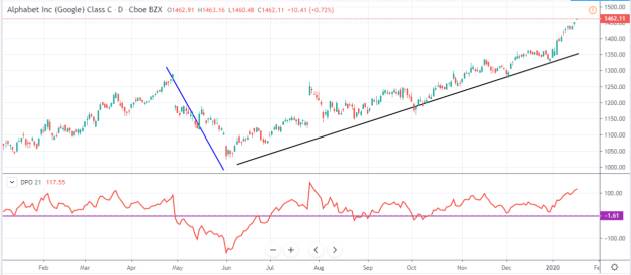
The idea is that if the Detrended Price line is moving from below the line and rising, it is an indication to buy. You should hold the trade so long as the DPO line is above the zero line.
As the price moves up, the DPO indicator will fluctuate but you should not focus on these fluctuations. Instead, you should focus on the line when it crosses the zero line.
Similarly, if the DPO line moves lower and remains below zero, it is usually said to be a sell signal. A good example of this is shown on the Google chart shown below.
Using the Detrended Price Oscillator with Moving Averages
Another option of using this oscillator is to use it together with moving averages. The goal of this approach is to combine a trend indicator and one that is removing the trend. The approach we prefer is where the DPO is combined with a double exponential moving average.
We prefer using the EMA because it tends to be more accurate than the SMA. This is because it usually places an emphasis on the last closing price.
In the example below, We used a 21-day DPO and combined it with a 21-day and 10-day EMA.
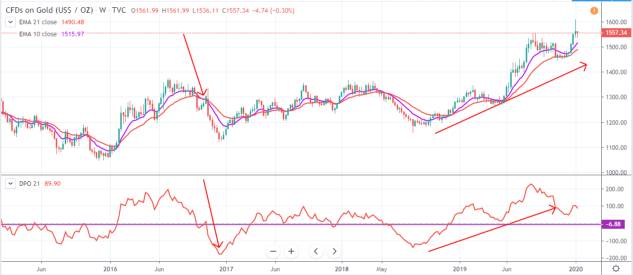
The goal of doing this is relatively simple. We want to use the double EMA to identify when a new trend is about to form. This is known as a crossover.
If it points to a reversal, We look at the DPO to confirm the trend. We also use a combination of these indicators to confirm an ongoing trend.
Using the DPO indicator and volume
Volume is an important part of day trading and investing. In most cases, traders incorporate the concept of volume with other indicators like moving averages, Relative Strength Index (RSI), and the MACD.
In most cases, trends are supported by higher volume. In the case of the DPO, most traders place trades based on the Detrended Price Oscillator during increasing volumes. They also avoid the indicator when there is limited volume.
Limitations of the DPO indicator
The DPO indicator has a number of limitations. First, unlike other popular indicators, it does not provide a signal on when to buy or sell an asset. Therefore, in most cases, this indicator is not ideal for day traders.
Second, the indicator ignores an asset’s trend, which is one of the most important parts of day trading. Third, the DPO indicator is not ideal for day trading. Instead, it is used mostly in investing or position trading.
Finally, the indicator’s peaks and troughs are not enough to help you predict the next price action. Besides, the market cycles don’t always mirror each other or rhyme.
Final Thoughts
The Detrended Price Oscillator (DPO) is not an indicator that many people know about. However, we have been using it for a while and we believe it is one of the most accurate indicators to use.
As a trader, we recommend that you first read more about it. We recommend that you use a book called; Technical Analysis: The Complete Resource for Financial Market Technicians. It is written by Charles Kirkpatrick and Julie Dahlquest, and It is an excellent resource.
Also, We recommend that you practice the indicator, using it standalone or as a combination of other indicators. We suggest that you use it with the moving averages and the Average Directional Movement Index.
External Useful Resources
- Technical Analysis: The Complete Resource for Financial Market Technicians – GoodReads
- DPO chart example and strategies – Tradingview
