The diamond pattern is a relatively uncommon chart pattern in the financial market. Usually you can identify It at market tops and can signal a reversal of an uptrend. Its name comes from the fact that it has a close resemblance to a physical diamond.
In this article, we will look at what this chart pattern is, its characteristics and how you can use it in the market.
What is the diamond pattern?
The diamond pattern is a reversal pattern that is not very common. For starters, a reversal pattern is one that leads to a new trend from the existing one. For example, when there is a bullish trend, a reversal pattern will lead to a bearish one. Other reversal patterns are head and shoulders and rising and falling wedges.
The opposite of a reversal pattern is a continuation. When these ones happen, they send a signal that the price will continue in the exiting trend. Some of the most common continuation patterns are bullish and bearish flags and cup and handle pattern.
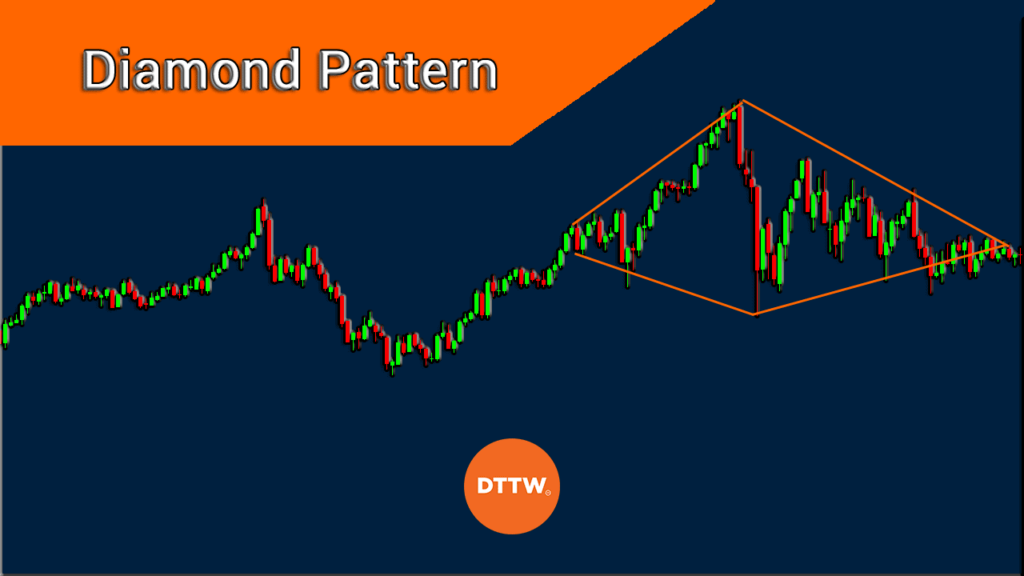
The diamond pattern is usually a sign that an asset’s price will start a new trend. When you draw lines on the chart, the pattern will have a close resemblance to a diamond. In most cases, the pattern looks like the head and shoulders pattern. The chart below shows how the the pattern looks like.
Characteristics of a diamond pattern
All chart patterns have unique characteristics. For example, a bullish flag has a unique characteristic in that it happens after an asset price has a parabolic move. It also has a close resemblance to a hoisted flag. Similarly, the diamond pattern has several unique characteristics.
First, a diamond top pattern happens when the asset price is in a bullish trend. A bottom one, on the other hand, happens when the asset’s price is moving in a bearish trend.
Second, the price will form what seems like a broadening wedge pattern. A broadening wedge happens when the peaks of the price are higher and the troughs are lower. In price action analysis, a broadening wedge pattern is usually a bullish sign while a descending broadening wedge is a bearish sign.
Third, after a while, the situation changes and the peaks become lower and the troughs become higher. Therefore, when you connect these lines, what comes out is a diamond-like pattern that looks as shown above.
How to identify It
Identifying a diamond pattern is more difficult than other patterns. That’s because it usually has several chart patterns in it.
As described above, the pattern has a broadening wedge pattern, which is usually a bullish sign. Therefore, it is possible to open a bullish trend hoping that the broadening wedge pattern will lead to a bullish breakout.
Another aspect is that the pattern has a close resemblance to the head and shoulders one. Therefore, we recommend that you embrace the virtue of patience when using the pattern to trade. At times, it could turn out to be a different pattern.
How to trade the diamond pattern
While diamond pattern is hard to find, when it forms, it becomes relatively easy to trade.
The idea behind this is simple: in most cases, the reversal will happen when the pattern is approaching its confluence zone on the right side. When this happens, some traders usually open a sell trade and benefit as the asset starts moving lower.
However, this is often a risky thing since this pattern does not always lead to a reversal. Therefore, many experienced traders embrace the concept of pending orders. A pending order is where you place a buy-stop, sell-stop, buy-limit, or sell-limit.
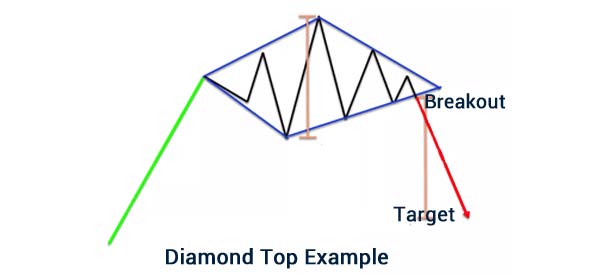
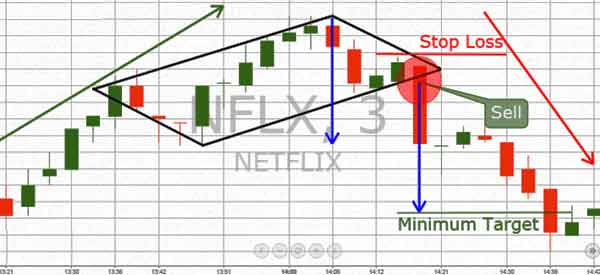
In case of a top diamond, a trader could place a sell-stop at the lower peak of the diamond pattern. After this, they measure the distance between the upper and lower sides of the diamond. They then measure the same distance from the lower side of the pattern. Finally, the lower side of this measurement becomes the target price.
A good example of this is shown in the chart below.
Final thoughts
In this article, we have looked at what the diamond pattern is. We have explained how it forms and some of the top strategies to use when trading using the pattern. Also, we have highlighted the risks involved when using the pattern.
External useful resources
- How to use diamond pattern for identifying trend reversal – Money Control
