As you have noted by now, there are several types of charts you can use in the markets. These include:
- Bar charts
- Line charts
- Candlesticks
- Heikin Ashi
- Renko
- Kagi
- Area Chart
Nonetheless, candlesticks are the most important types of charts used in the market today. These charts have been in use for centuries (they started being used in Japan in the 17th century).
There are several types of candlestick patterns that traders use. Some of these patterns are the evening star, morning star, doji, hammer, engulfing, and piercing lines among others.
Steve Nison, is one of the best-known writers on candlestick patterns. We recommend that you get his book, beyond candlesticks. This book will help you get to know more about candlesticks.
In this article, we will look at the Doji, which is an important type of patterns.
→ Technical Analysis: Briefing and Tons of Tools You Can Use
What is a Doji candlestick pattern?
A Doji candlestick is one where the opening price of an asset is usually the same as the close. When this happens, it is usually the perfect Doji.
However, there is a flexibility on this rule. If the two prices are not the same within a few ticks, this can be said to be a Doji. There is no rule as to how to apply this flexibility. It solely depends on you as a trader.
The Doji is an essential pattern to identify reversals.
How a doji pattern is useful to traders
A doji pattern is an important part in day trading because it usually tells traders that a reversal is about to happen. Therefore, if you are unsure about what will happen, the doji can act as a good guide to you.
If the multiple types of doji happen during a downtrend, it means that the asset will start a new uptrend. Similarly, if they happen during an uptrend, it means that the asset will likely start a new downtrend.
But like all types of candlestick patterns, you need to use several strategies before you initiate a trade.
» Related: What to Do Before You Place a Trade?
Doji Candle analysis
So, one of the most important uses of the Doji is to identify when there is a reversal, we should have figured it out. This can also be called as a bottom or a top. A top is a place where a rallying asset starts a new downward trend. A bottom is when a rallying asset starts moving upwards.
Dojis are good for reversals because they present indecision, uncertainty, or vacillation by buyers in an uptrend and sellers in a downtrend. We can easily realize this by looking at the length of the candle shadow.
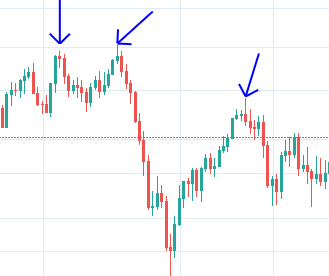
In the chart below you can see a good example of Dojis at the top. As you can see, the price starts to move lower after the Doji is made.
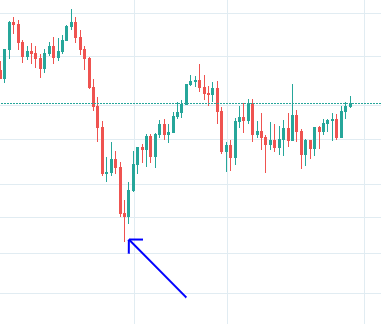
It can also happen to indicate a bottom. You can find a good example of this below.
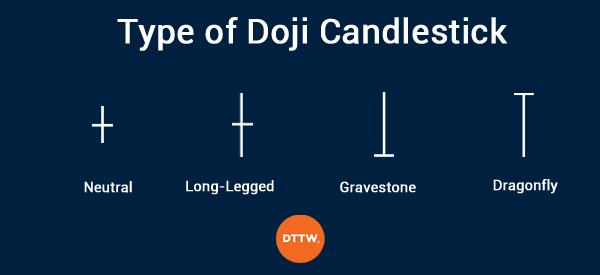
Types of Doji Candlestick Pattern
There are four main types of Doji candle patterns. Below we deal with the three most particular cases, avoiding the basic one (similar to a plus). Just know these for a good understanding of the tool.
Long-Legged Doji
First, there is the long-legged doji. This is made up of a long upper and lower shadows. It has an approximately similar opening and closing prices. This Doji is usually a signal of indecision after a long upward or downward rally.
As such, they tend to be indicators of a consolidation phase.
Dragonfly Doji Candlestick Pattern
The other type of Doji is the dragonfly doji. It is formed when the open, high, and close prices of an asset are similar. When there is a long lower shadow, it suggests that there was an aggressive selling phase. Buyers were able to withstand the selling and push the price up.
When there is an uptrend, the dragonfly Doji is usually a signal that more selling could be coming up. When there is a downtrend, it is a signal that there is an upward trend on the way.
Gravestone
Another type of Doji is the gravestone pattern. This is a bearish pattern that is formed when the open, low, and closing price of an assets are all close to one another with a long upper shadow.
When there is an uptrend, a gravestone Doji is usually a signal to exit or start a bearish pattern.
› Bear Market: 5 Tips to Make Money
Doji trading strategies
There are several doji trading strategies today. Some of the most popular ones are:
- Using pending orders. This is a strategy where you place a pending order above or below the key levels of the doji pattern. For example, you could place a buy-stop trade above the gravestone doji. If a reversal happens, this buy-stop trade will be triggered. Similarly, you could set a sell-stop below the lower side of the dragonfly doji.
- Using doji in trend following – In an uptrend, an asset will tend to retreat slightly. During this pullback, a doji can tell you when the uptrend is set to continue.
Doji vs Spinning top
In the description above, we have explained that a doji pattern happens when an asset opens and closes at the same level. Therefore, because of this description, the pattern is often confused with spinning top.
Spinning top is usually a continuation pattern that happens when buyers and sellers balance out. As a result, it usually has a long upper and lower shadow and a small body. A good example of this is shown below.
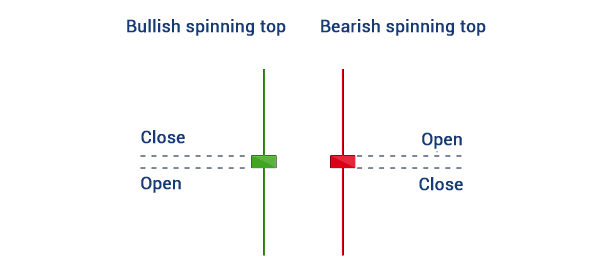
While a doji is usually a sign of a reversal, a spinning top is usually a sign of continuation. The pattern tells traders that there is uncertainty in the market. That’s because there is no clear victor between buyers and sellers.
Pros and cons of Doji
There are several benefits and disadvantages of using the Doji pattern. Let us look at the advantages first.
- Doji is a popular candlestick pattern. This means that you can identify it regularly when trading.
- Timeframes – Doji can be identified in all chart timeframes.
- Easy to identify – It is easy to identify the multiple types of a doji pattern in a chart.
- Accurate – Although it is not always accurate, Doji is usually better to use than other candlestick patterns.
On the other hand, some of the top cons of the Doji candlestick are:
- False positives – At times, the candlestick pattern can show a false positive of an asset.
- It takes time to confirm whether a reversal is indeed happening.
FAQs
Is the Doji bullish or bearish?
Is Doji a sign of reversal?
What happens after a doji?
Final Thoughts
Doji candlestick pattern have been in use for centuries. As with other candlestick patterns, this started being used in Japan in the 17th century (in rice trading for the most). While these patterns are essential, you need to realize that they are never accurate.
As such, it is usually important to use them in combination with other technical indicators like moving averages and RSI.
External Useful Resources
- Learn When A Doji Is Formed In Candlestick Patterns – Commodity.com
- Understanding The Doji Candlestick Pattern In Technical Analysis – Market Realist
