Moving averages (MA) are the most popular indicators in the market today. Traders use them in trend-following, reversals, and other strategies. Most importantly, they have been used in the creation of other indicators like Bollinger Bands and Donchian Channels.
In short, MA is a fundamental tool for a trader. Moreover there are different types, depending on what we want to consider in our analysis.
In this article, we will look at the concept of an exponential moving average (EMA) ribbon and how you can use it in the market.
What is an EMA ribbon?
As stated above, there are several types of moving averages including simple, smoothed, exponential, volume-weighted, Hull, least squares, and Arnaud Legoux.
Simple moving average is the most basic of them since it is calculated by just adding data and then dividing the results by the number of periods. The other moving averages usually attempt to remove the lag that exists in the SMA.
The exponential moving average removes the lag by prioritizing the latest numbers. For example, if it is on a Friday, the MA will put more emphasis on data from Thursday instead of those from Monday.
One way of using moving averages is to use several periods. For example, you can add a 15-day, 25-day, and 50-day moving average. This model is used both in trend following and in trading reversals.
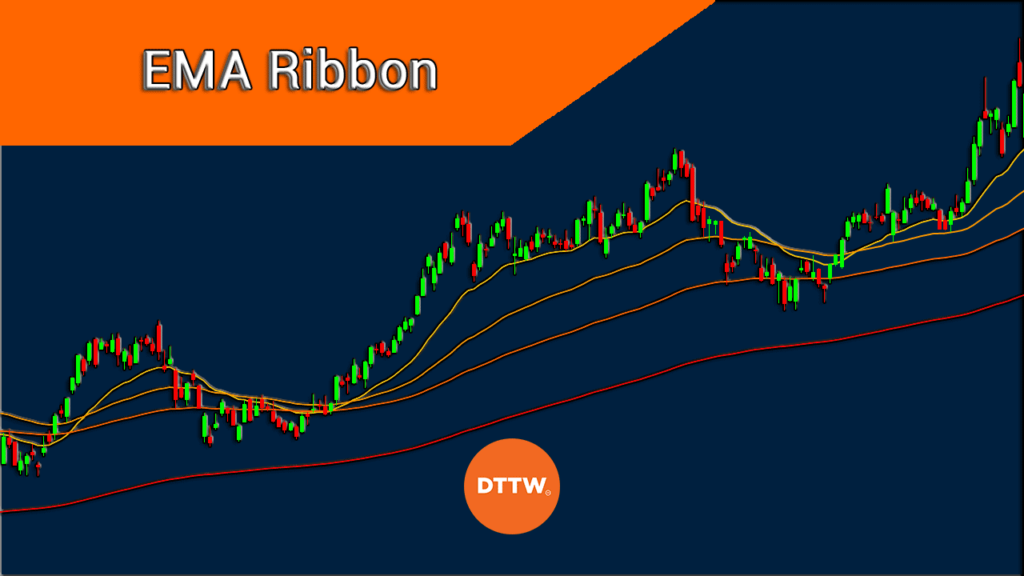
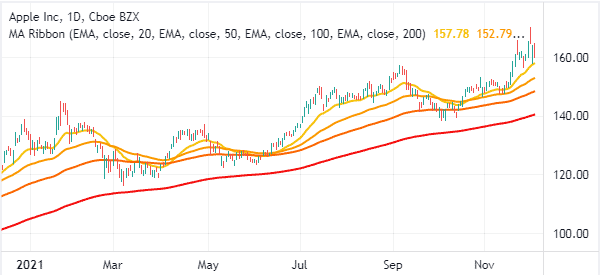
The moving average ribbon is a single indicator that includes several moving averages of different lengths. The chart below shows the Apple stock with a moving average ribbon. The ribbon has a 20, 50, 100, and 200-day moving averages.
Ribbon settings
The moving average ribbon is provided by several trading platforms, including TradingView. There are several settings that you can tweak. First, as shown below, you can tweak the type of MA that you want to choose. The options here are the simple MA, smoothed MA, weighted MA, and the volume-weighted MA.
You can also change the number of MAs that you want in the chart. The default is four but you can select two of them. Next, you could change the data to watch. Most people usually apply the closing data but you can always change it to match your strategy.
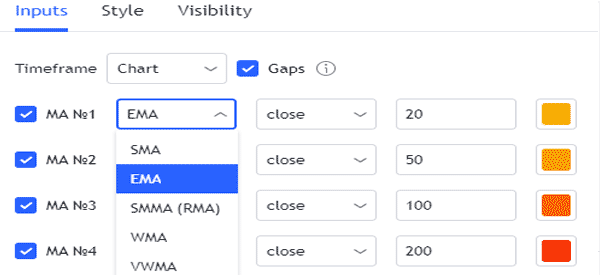
In a MA ribbon, you can change the periods to use. The default periods are 20,50, 100, and 200. For a day trader, some of these periods won’t apply. Finally, you can change the colors of the ribbons to match your strategy.
Calculation of the EMA ribbon
As mentioned, the EMA ribbon is made up of several EMAs. Therefore, the only way to calculate it is to calculate the specific EMAs.
The EMA is calculated in a relatively simple way. First, you need to calculate the simple moving average of the asset. Here, you just sum the closing prices of the period and then divide by the period.
Second, you need to calculate the weighting multiplier. Finally, you should calculate the RMA for each day between the initial EMA value and today.
Since this is a ribbon, you should repeat the calculation for the other periods you want to add. However, most day traders don’t do this. Since the ribbon is already provided, all they need to do is to apply it on a chart and then tweak the settings above.
What does the EMA ribbon tell you?
Interpreting the EMA ribbon is equally simple as well. In an uptrend, if the price is above the ribbon, it means that bulls are in total control of the situation.
The warning that the bullish trend is about to end happens when the asset’s price starts to move below the initial moving average. Similarly, in a bearish trend, the price will always be below the EMA ribbon.
Another thing is the width of the Exponential ribbon. For example, when all MAs are running in parallel, this means that the trend is relatively strong.
If the ribbon is widening, it means that the current trend is about to end. If it is contracting, it means that there is a start of a new trend.
Exponential Moving Average ribbon strategies
EMA ribbon in trend following
One of the easiest methods of using the EMA ribbon is in trend following. This is where you add a ribbon and watch the trends. If it is in a bullish trend, the price will remain above the EMA ribbon. Therefore, you can continue buying the asset as long as it is above this moving average.
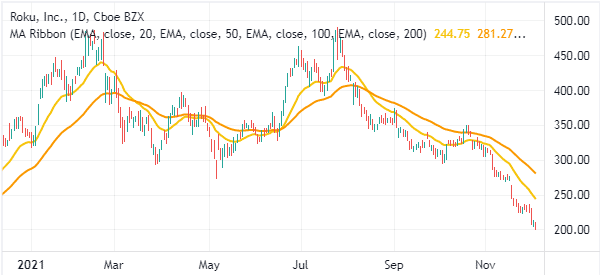
The warning sign that the trend is starting to fade is when it moves below the first moving average. The sell-off is confirmed when it moves below the second average. A good example of this is in the Roku share price below.
Ribbon in reversals
Another way of using the EMA ribbon is what is known as a reversal. This is where you confirm that a reversal has happened when the two lines make a crossover.
One of the most common patterns is known as a death cross or a golden cross. A golden cross happens when the 50-day and 200-day moving averages make a bullish crossover. Most day traders use shorter timeframes when trading these ribbons. You can also use the EMA ribbons to establish support and resistance levels.
Benefits of using the EMA ribbon
There are several pros for using the EMA ribbon. First, it is a simple way of adding multiple moving averages in a chart. Second, it can even save you money when you are using the free version of TradingView. That’s because you need to be a subscribed member to use more than three indicators. Finally, it is one of the most accurate strategies to trade.
Final thoughts: Is it worth using it?
The EMA ribbon is an important tool that can be used by both experienced and inexperienced traders. In this article, we have explained how it is calculated and identified some of the most popular strategies for using it.
External Useful Resources
- Analyze Financial Markets With the Moving Average Ribbon – IQ Option
