There are several types of candlestick patterns. We have just covered several patterns, including morning and evening star, dark cloud cover, and hanging man among others.
Today, we will continue with this journey and cover engulfing patterns, which are easy to identify reversal patterns.
We will look at what these patterns are and how you can use them in the financial market.
What is an engulfing pattern?
An engulfing pattern is a reversal pattern which is found in all types of candlestick patterns. A bullish engulfing happens during a downtrend while a bearish one forms during an uptrend.
The two happen when a small candlestick is followed by a bigger opposite candle. According to the Japanese, when a bullish engulfing candle forms, the bears are usually immobilized and vice versa.
For an engulfing pattern to happen, the second real body must engulf an opposite real colour.
As you will find out, there are many of this patterns in the market but not all of them are relevant. Indeed, analysts believe that for a real engulf to happen, the first candle needs to be small and the second candle very large.
Below is a good example of how a bullish engulfing pattern looks like.
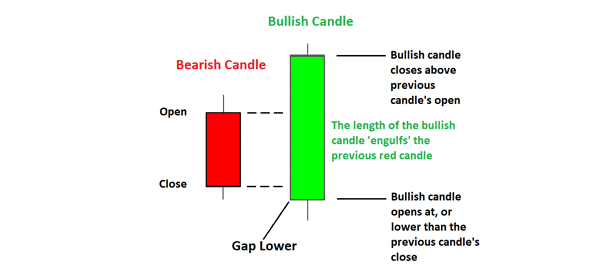
Key qualities of a bullish engulfing pattern
A bullish engulfing pattern has three main qualities.
1- It needs to be formed during a period when the price of an asset is in a downward trend.
2- The size of the green (bullish) candle needs to be bigger than the preceding candle, including the upper and lower shadows.
3- A stronger signal is shown when the first candle is a doji.
What bullish and bearish engulfing patterns tells traders
As mentioned above, a bullish engulfing pattern happens during a downtrend. It happens when a small bearish candlestick is completely covered by a bullish candle. The body and upper and lower shadows of the bullish candle must completely surround that of the bearish candle.
On the other, a bearish engulfing pattern happens in an uptrend, when a smaller bullish candle is completely surrounded by a bigger bearish candle.
A bullish and bearish engulfing patterns usually tells traders that an existing trend will likely start turning around. In other words, it tells them that a reversal will start to happen.
You can also spot reversals through the use of trading indicators.
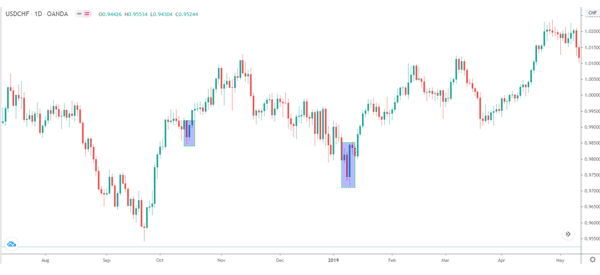
Example of a bullish engulfing pattern
A good example of this pattern is shown below. As you can see, the USD/CHF pair was in a downward trend when a smaller red (bearish) candle was followed by a bigger bullish candle.
In other words, the red candle was engulfed by a large bullish candle, leading to a new upward trend.
Bearish engulfing pattern
A bearish engulfing pattern is the exact opposite of the bullish one. It forms during an uptrend where a smaller bullish candle is engulfed by a bigger bearish candle.
A good example of this pattern is shown in the silver chart below.
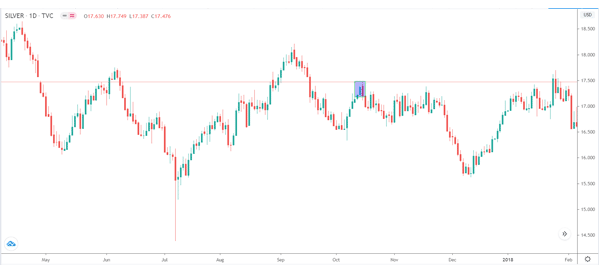
As you can see, silver price was up for 6 consecutive days. On the final day, the green candle was followed by a bigger bearish candle.
In the days that followed the price started moving in a downward trend.
Last Engulfing Pattern
In addition to the two patterns, there is another one that is known as a Last Engulfing Pattern.
This is when a bearish engulfing pattern is formed during a bearish trend. When it happens, it is usually viewed as a turning point for the bulls if the price closes above the bullish candle’s close.
Advantages of engulfing patterns
There are several benefits of using bearish and bullish engulf candles:
- Easy to spot
- Easy to interpret
- It tells a trader where to put a stop loss or a take-profit.
- Can be used in addition to other tools like Fibonacci retracement and Pitchfork
- Can be combined with other technical indicators
- Tend to be relatively accurate
Cons of engulfing patterns
- At times, a reversal is usually not guaranteed when an engulfing pattern happens.
- An engulfing pattern on one chart could be another pattern in the same chart but of diffferent period.
Final thoughts
Engulfing patterns are exceptional price action strategies that can tell you when a reversal is about to take place. To use them well, you need to take time to practice using a demo account. Doing this will help you avoid false breakouts.
External useful Resources
- Bullish and Bearish Engulfing- Probably The Best Price Action Candlestick Patterns – FxStreet
- Bearish Engulf Candle Definition and Tactics – Investopedia
