Moving averages are essential parts of the trading industry. If you have read or even watched trading-related media, you must have heard about these averages.
The averages are fundamental in providing essential signals. They are also important building blocks of other technical indicators such as momentum and Bollinger Bands, that we have looked at before.
In this report, we will look at exponential moving average and how you should use it in the market.
What is Exponential Moving Average (EMA)?
To better understand what EMA is, we need to look at its foundation. The EMA is a derivative of basic or simple moving average (SMA).
The SMA is calculated by taking the close, open, high, or low price of an asset within a certain period, adding them, and dividing it with the period.
For example, if the price of a stock in three days is $25, 30, and $28, the SMA is $27.
On the other, the exponential moving average tends to reduce the lag provided by the SMA. It does this by adding more weight to the recent prices of an asset.
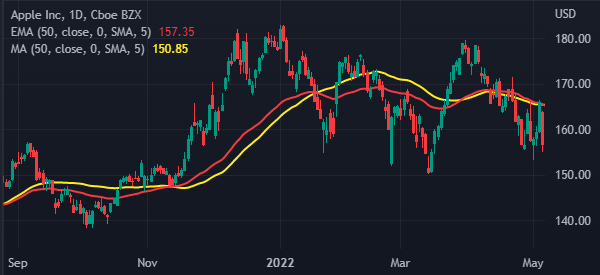
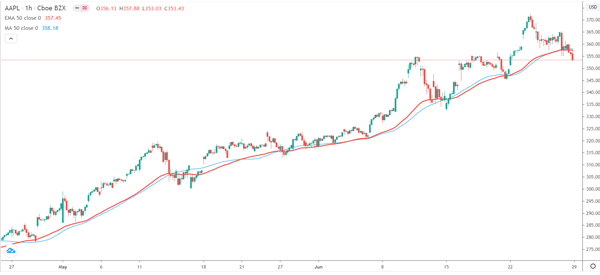
In this, the EMA of an asset today depends on the EMA calculation of all the previous days. The chart below shows the 50-day EMA (red) and the 50-day SMA of Apple.
Exponential moving average calculation
The process of calculating the EMA is usually relatively different with that of the SMA. There are three key steps in calculating this average:
- You need to calculate the SMA of period you are focusing on. In this, you just add the values and then divide by the periods.
- You need to calculate the weighting multiplier. You do this by using the following formula: [Multiplier = (2 / (Time Periods + 1))]
- After that, you calculate the EMA for each day using the closing price, the multiplier, and the previous day value.
The third step is calculated as shown below:
| EMA = (Close – EMA (previous day)) x multiplier + EMA (previous day) |
Do not worry if this seems complicated. As we have said before, you don’t need to know how to calculate the EMA. Indeed, most people in Wall Street don’t know how to do the calculation.
Instead, you just need to know how to apply it on the chart and interpret it.
What does the EMA tell traders?
The EMA tells traders a few things. For example, when the price is trading at the same level as the EMA, it is a sign that there is no volatility in the market. You can confirm the absence of volatility using other indicators like the Bollinger Bands and the Average True Range (ATR).
Second, the EMA can tell you whether an asset is expensive or cheap. For example, if a stock is trading at $50 and the 25-day moving average is at $30, it is a sign that it is relatively expensive. This expensiveness usually happens because of a major thing such as strong news or a strong event.
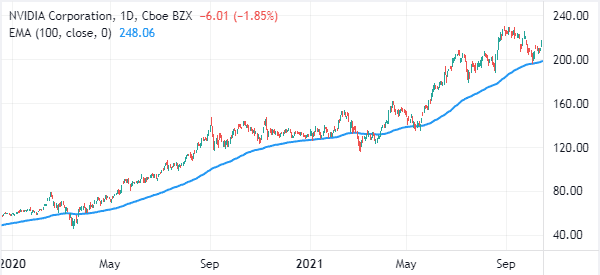
The chart below shows that the Nvidia stock price is a bit expensive since it was significantly above the 100-day moving average.
Third, the Exponential Moving Average (EMA) can tell you whether a trend will keep rising or have a reversal. In an uptrend, if a stock remains above the EMA, it is a sign that the bullish trend will continue. On the other hand, if a stock crosses the average, it is a sign that a reversal is about to start.
» Related: What is trend trading?
EMA vs the Relative Strength Index (RSI)
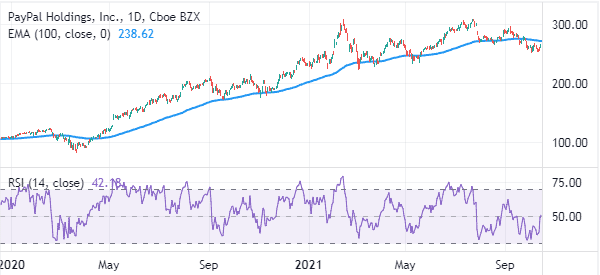
The EMA are very different from the RSI. While the EMA is a trend indicator, the RSI is a momentum or oscillator. The RSI is mostly used to identify overbought and oversold levels. The chart below shows the PayPal stock with an RSI and EMA.
EMA vs SMA
The EMA is also relatively different from the simple moving average (SMA). As mentioned above, the EMA attempts to smooth the calculation of the moving average. The SMA does not smooth any data. Instead, it takes all periods equally.
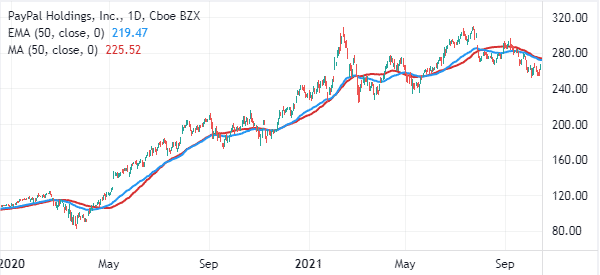
Still, most traders use the EMA and the SMA in the same way. The chart below shows the PayPal stock with a 50-day EMA and SMA.
EMA vs Double EMA (DEMA)
The Double EMA is an indicator that goes further in reducing the lag that exists in the main EMA. This makes it more ideal to short term traders.
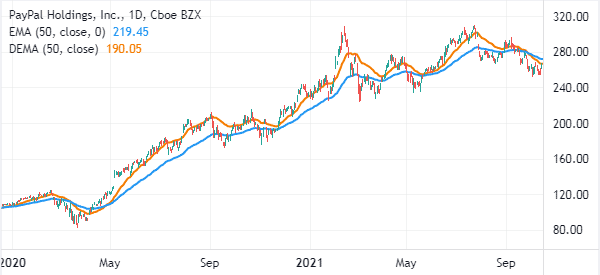
The DEMA indicator is calculated by first finding the EMA. Next, you calculate the EMA of the first EMA. Finally, you multiply the first EMA by 2 and then subtract EMA2. The chart below shows the 50-day EMA and DEMA in a chart.
How to use the EMA
There are several ways of using the exponential moving averages. The one We prefer is to use the indicator to find reversals. A good way to do this is to use a fast and a slow EMA.
A fast EMA is a shorter-period one while a slow one is a longer-dated one.
The idea is to note where the two indicators have a crossover. When this happens, it is usually a signal that the price will start to reverse.
A good example is shown on the EUR/USD pair below. As you can see, the price tends to reverse when the 14-day and 28-day exponential moving averages cross over.
EMA in reversals
As stated above, You can use the EMA to trade reversals. For starters, a reversal is a period where an upward trend starts to end leading to a new bearish trend and vice versa.
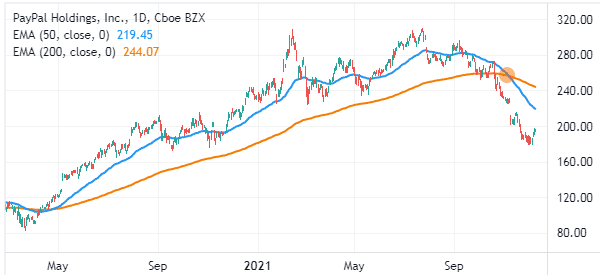
One of the most popular methods of finding this reversal is known as a death cross or a golden cross. A death cross happens when the 200-day and 50-day moving averages make a bearish crossover. A golden cross is when they do a bullish crossover. The chart below shows that the PayPal stock formed a death cross as it crashed.
EMA in trend following
You can also use the EMA in trend-following as we have shown above. The process is usually relatively simple. First, identify a chart that is moving in an upward or downward trend. Second, identify your preferred EMA period to add to the chart.
In this case, the bullish trend will remain intact as long as the price remains above the moving average. For example, in the chart below, the Nvidia share price will remain in an upward trend as long as it is above the 50-day moving average.
We’re re-posting the chart, to simplify things and let you have it at your fingertips.
Third, you can use the EMA to find support and resistance levels.
Advantages of using the exponential moving average
There are several benefits of using the EMA. First, it is among the simplest indicators you can use in the market as shown above.
Second, the EMA tends to be relatively accurate, especially when you are identifying reversals.
Third, the EMA can be used easily with other indicators like MACD and momentum.
Finally, if you are a statistician, it is relatively easy to calculate the indicator.
Final thoughts
If you are serious about trading, then moving average is a must indicator to know.
A good way to start is to come up with a strategy using paper trading. As you can see above, We tend to use the 14-day and 28-day EMAs.
You can experiment with other numbers as you craft the strategy.
External Useful Resources
- How Is the EMA Formula Calculated? – Investopedia
- Filtering Out Price Noise With The Exponential Moving Average – Admiralmarkets
