A flat-top pattern is one of the many ways of trading breakouts in the financial market. As the name suggests, it happens when the price of an asset meets a substantial resistance and struggles to move above it for a certain period.
Well, now that you have an idea of what you’re about to read, let’s get right to the good stuff: what a flat-top pattern is and how you can use it to trade all assets like currencies, commodities, and equities.
But first, a necessary premise. The concept of Breakout.
What is a breakout?
To understand what this pattern is, it is important that we look at what a breakout is. For starters, a breakout is a situation where an asset’s price moves sharply higher or lower after a long period of consolidation. A bullish breakout happens when the price rises after this consolidation while a bearish breakout happens when it moves sharply lower.
Day traders use different strategies to trade breakouts. Some use technical indicators like moving averages to predict the direction of the breakout. Others use price action strategies like triangles, head and shoulders, and rectangles to predict the possible direction of the breakout.
The flat-top pattern is another price action arrangement that is used to determine this price action.
What is a flat-top pattern?
As the name suggests, a flat-top pattern is a situation where the price of an asset like a stock, commodity, or ETF finds a major resistance during a bullish trend. For example, a stock can rise to $20, drop back to $18, attempt to recover, and face another resistance at $20. It can then continue this cycle for a while, forming what is known as a flat top.
Ideally, a flat-top pattern happens because of the psychological nature of the financial market. After hitting a resistance, some traders are simply afraid of holding the assets above that level. A good example of this pattern at work is in the chart below.
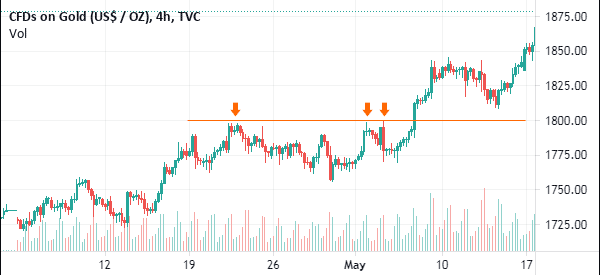
In this chart. We see that the price of gold was in a bullish trend when it hit a major resistance at $1,798. It struggled to move above this level for a number of trading sessions. Ultimately, the price broke out higher.
A flat-top pattern is a bullish signal
As shown above, the price of gold broke out higher after finding a lot of support at $1,798. This happened simply because a flat-top pattern is often seen as a bullish continuation pattern.
Indeed, a closer look at the flat-top pattern shows that it has a close resemblance to an ascending triangle. The only difference is that the diagonal line does not always happen in a flat-top pattern.
A continuation pattern is usually a sign that an existing trend has just paused and that it will keep rising. Let us look at further examples to have a better understanding.
Flat-top pattern examples
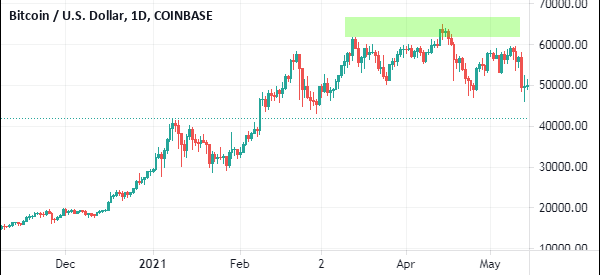
In the daily chart below, we see that the Bitcoin price surged to an all-time high of almost $65,000. After that, the price struggled to move above this level after weeks of trying. While the bullish breakout has not yet happened, we can easily predict that the price will likely break out higher in due time if not affected by some major news.
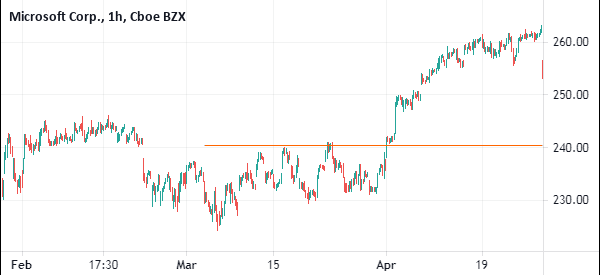
In the next example below, we see that the Microsoft stock price struggled to move above $240. At this level, the stock found some strong resistance. Ultimately, the shares managed to move above the resistance level.
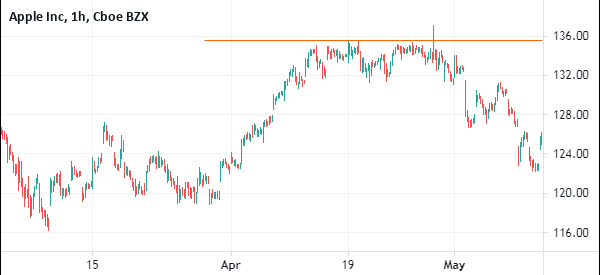
However, it is worth noting that a bullish breakout is usually not mandatory. In fact, as shown below, a flat-top pattern can lead to a bearish breakout. The chart shows that Apple shares struggled moving above the resistance at $135. They effectively formed a flat-top pattern at this level. However, instead of having a bullish breakout, the stock declined.
Flat-top pattern trading strategies
The final point above brings an important fact in the market. It simply shows that there are times when the strategy fails to hold steady.
Therefore, one way to avoid being caught in a false breakout is to use pending orders. In this case, if the resistance is at $50, you could put a buy stop pattern at $53. In this case, if the price manages to move above this resistance, a buy trade will be initiated and it will become a new market order.
Final thoughts
A flat-top pattern is a popular continuation pattern that is used to trade all types of assets. The pattern works well to identify whether the asset’s price will continue rising or not. In this article, we have looked at how the pattern works and how you can trade it well.
External Useful Resources
- Flat Top Breakout Trading – New Trader U
