Oscillators are some of the most useful indicators in the market. Some of the most popular oscillators in the market are the Stochastic oscillator, Relative Strength Index (RSI), Relative Vigor Indicator (RVI), and the Commodity Channel Index (CCI).
In this article, we will look at the Gator Oscillator, which is a relatively unpopular oscillator in the market.
What is the Gator Oscillator?
Gator Oscillator is an indicator that was created by Bill Williams. Williams’ other indicators are fractals, alligator, accelerator oscillator, and the market facilitation index (MFI) among others.
The Gator Oscillator was designed in a bid to help traders identify the convergence and divergence of the balance lines. As a result, one can see when a market is trending or range-bound.
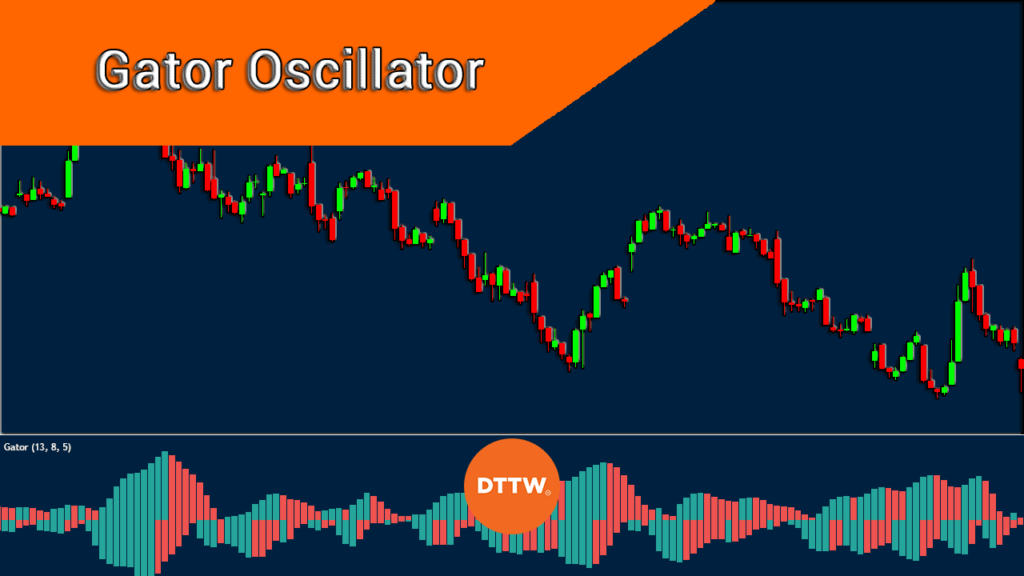
When applied on a chart, the Gator oscillator has one horizontal line and red and green bars. This is shown in the chart below.
How this Oscillator is calculated?
The Gator Oscillator calculation is relatively easy to understand. Still, like all indicators, it is not mandatory for a trader to understand how the oscillator is calculated. What you simply needs to know is how you can use it in the market.
First, you need to calculate the blue alligator jaw. You do this by taking a 13-period simple moving average (SMA) of the asset with 8 bars forward.
Second, you should get the red alligator teeth. You do this by taking the 9-period SMA 5 bars forward. And finally, you should calculate the green alligator lip. This is where you find the 5-period SMA for the 3 bars forward.
Therefore, as you can see, the Gator oscillator is based on the simple moving average. Still, some analysts have moved a step further and used other types of averages like the exponential, volume-weighted, smoothed, and weighted.
As you can see above, the Gator Oscillator has red and green bars above and below the neutral line. The bottom bar of the indicator represents the difference between the red teeth and the green lip line. The upper bars represent the difference between the blue jaw and the red teeth lines. The green line shows that the price rose while the red line shows that the price declined.
Interpreting the Gator Oscillator
As shown above, it is relatively easy to interpret the Gator Oscillator. Traders use four key ways to interpret the GO oscillator in the market.
1. Sleeping Mode – When the blue and red line are hovering near the neutral line, they say that it is in a sleeping mode. In this period, the indicator usually show little or no movements.
2. Awakening Phase – The second scenario is when one bar turns green while the other one is red and vice versa. When this happens, they typically interpret it to mean that it is in the awakening phase.
3. Eating Phase – The Gator oscillator can be in the eating phase. This happens when there are bullish or green bars on the two sides of the indicator. When this happens, the difference between the two sets of the moving average tends to grow as well.
4. Sated Position – Finally, when one of the two sides turns red, it is a sign that a trend is in a deceleration mode. As such, this means that there is a possibility that the trend is decelerating, which leads to a reversal. The gator is said to be in a sated mode when this happens.
How to trade the Gator Oscillator
Different traders have different approaches when trading using the Gator Oscillator. Most of them trade it when the market is moving in a bullish or bearish trend.
Ideally, most traders open a buy position when the indicator opens and then exit when the trend exhaustion phase ends. One can also take profit or exit their trades when the indicator moves in a sated position.
In all this, it is always recommended that you combine the oscillator with other trend-following indicators. The most popular trend-following indicators are moving average and the Bollinger Bands.
GO Example
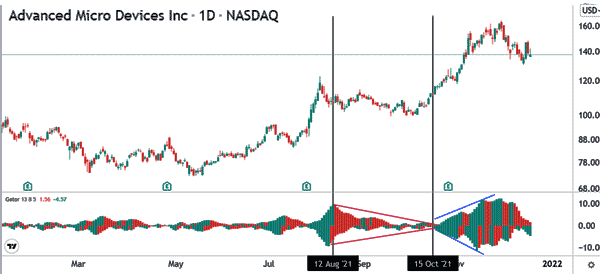
A good example of the Gator Oscillator is shown in the AMD stock shown below. As you can see, the indicator is in a consolidation phase when the stock is in a range-bound market. When this happens, it is relatively difficult to trade it because the distance between the levels is narrow.
One of the best ways to trade in this condition is to wait for the Gator Oscillator to start widening as shown in blue. This pattern simply means that the number of bulls is more than bears. You then exit the trade when the gap starts to reduce.
Summary
As you have been able to understand, the Gator Oscillator is not a tool that we can always use, as it could be an MA, but in some situations especially if combined with other indicators, it can provide very good indications to enter or exit a trade. We have also looked some of the top strategies to use when using the indicator.
External useful Resources
- Wake up to the Market Trend with the Gator Oscillator – Admiral Markets
