It is difficult for a trader to make a decisive decision without critically evaluating relevant information about the market.
One of the effective tools in this decision-making process is price action trading strategies. This trading strategy usually identify market movements based primarily on the preceding price variations.
This strategy usually encompasses an array of technical analysis elements such as price band, charts, high and low swings, and trend lines.
With reference to this form of trading, a trader can adopt one of two approaches:
- On the one hand, you can choose to observe the market by relying on simple patterns like breakouts, trend lines, and price bars.
- Alternatively, you can use a detailed combination of candlesticks, channels, and volatility.
In previous articles, we analyzed various price action strategies such as the bullish and bearish pennants, triangles, cup and handle, shooting star, and bullish and bearish flags.
In this article, we will shift our focus to the hammer candlestick.
What is a Hammer Candlestick?
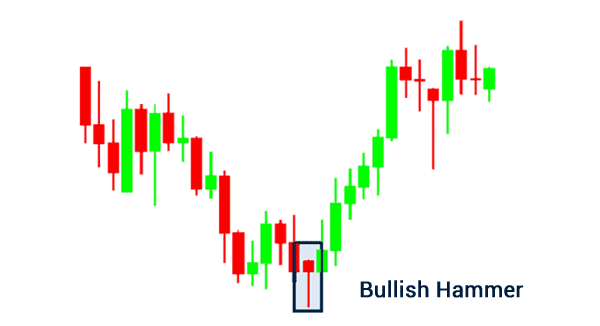
It is a price pattern that usually occurs at the lower end of a down trend. In candlestick charting, it points to a bullish reversal. This means: the price reached new lows but closed at a higher level due to resultant buying pressure.
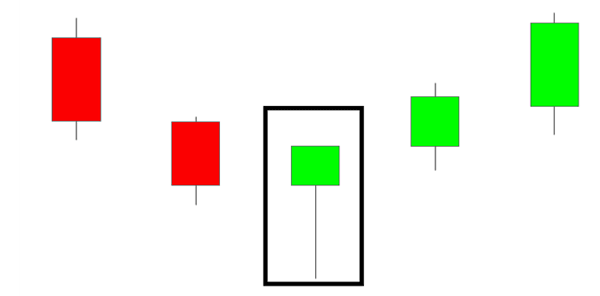
As part of its characteristic appearance, it has a relatively tiny body, an elongated lower wick, and a small or no upper wick. In fact, it resembles a hammer. The prolonged lower wick signifies the rejection of the lower prices by the market.
How a hammer candlestick forms
A hammer candlestick pattern forms in a relatively simple way. For one, it mostly forms at the end of a bearish trendline. This means that when you see a see a hammer candlestick pattern in a ranging market, it is not always a good thing to buy.
A hammer pattern forms when a candle breaks out in the green and then it loses some of those gains. However, the price then closes slightly above the previous close, as shown above.
It is characterized by a long lower shadow and a small body. At times, the candlestick can have a small upper shadow or none of it.
When a hammer forms in a bullish trend, it is known as a hanging man and is usually a bearish sign. It can also be a shooting start pattern when it has a small body and a long upper shadow.
How to Trade the Hammer Candlestick
Let’s take the following example of the EUR/USD to see how to use the hammer candle in the technical analysis.
The hammer candlestick is a useful tool for a trader when determining when to enter a market.
In the example above, the price reached a new low and then reversed into a higher level. The area that connects the lows is referred to as the zone of support. It acts as a rubberstamp to the reversal signal yielded by the hammer candlestick.
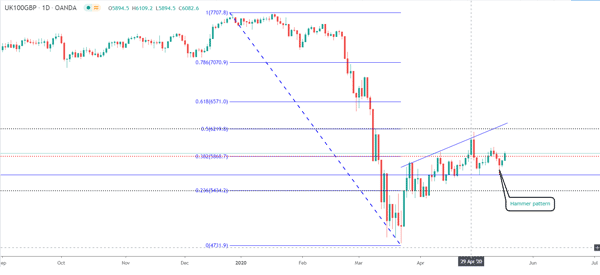
As shown in the zoomed-in chart below, place the stop loss below this zone of support. As long as one maintains a positive risk-to-reward ratio, targets can be on the same level as the recent resistance level.
The chart below shows the hammer pattern on the FTSE 100 index.
Hammer vs inverted hammer pattern
A hammer pattern forms at the end of a bearish trend. At the same time, it is possible for the opposite to happen. An inverted hammer pattern happens when the candlestick has a small body and a long upper shadow. This candlestick is usually a bullish sign.
Another type of inverted candlestick pattern is known as a shooting start pattern. It is formed with a small body and a long upper shadow. These inverted hammer candlesticks are usually a sign of reversal.
Hammer vs Doji
Another popular candlestick is known as a doji. The only similarity between a doji and hammer candlestick is that they are both signs of reversals. They are different in terms of appearance. While the hammer pattern has a relatively big body, the doji pattern does not have a body since the price usually opens and closes at the same level.
Still, some types of Doji patterns can have a resemblance to a hammer pattern. These types of dojis are known as the dragonfly and gravestone doji. A dragonfly doji has a very small body on the top while a gravestone doji has a very small body and a long upper shadow.
Hammer Candle: a good or bad Trading Pattern?
Advantages
Exit signal: the pattern indicates the subsidence of the selling pressure. For a trader with a short position, this is a helpful tool since it signals an apt opportunity to close on the short position.
Reversal signal: the pattern usually shows a rejection of the decreased prices.
In the event of a downtrend, the presence of this candle probably means that the selling pressure has ended and that the market may now experience a sideways or upwards trade.
Drawbacks
Need for supporting evidence: for a trader to enter a trade with high probability, it is crucial to conduct further analysis in order to be certain about the reversal.
To do so, you can check if the hammer candle occurs close to the main level of a pivot point, support, or Fibonacci level.
You can also check if the overbought signal results from the RSI, CCI, or stochastic indicator.
Conclusion
Just like the price action trading strategies that we have looked at before, the hammer candlestick is a useful tool for traders. It aids one in identifying the apt time to enter a market.
However, to increase your rewards and lessen the risks, it is important to get additional information about the market through technical and fundamental analysis.
External Useful Resources
- Hammer Candlestick Formation in Technical Analysis – Commodity.com
- The Hammer Candlestick Formation – Forex.com
