Harmonic patterns are advanced trading patterns that help tell traders when to buy or sell financial assets like stocks, currencies, and commodities.
These patterns are relatively difficult to identify and require advanced knowledge in other tools like the Fibonacci retracement. In this article, we will look at what these harmonic patterns are and some of the top strategies to use when trading them.
What are harmonic patterns?
Harmonic patterns are part of the mechanics of day trading. Unlike other price action patterns like triangles, rectangles, and head and shoulders, these patterns are usually more difficult to draw and identify.
However, when you master their approaches well, the process will often become relatively easy to use. When used well, a harmonic pattern can help you identify a reversal or when an asset will make a continuation pattern.
How to draw these patterns
Harmonic patterns are typically drawn using the tools that are provided by chart providers like MetaTrader and TradingView. In our experience, we believe that the TradingView platform provides the best platform for drawing these patterns.
First, you will need a Fibonacci retracement tool. This is a tool that has several key points as explained using the Fibonacci sequence.
Second, you will need trendlines that are offered by the platforms. TradingView makes it easy by providing sketches of some of these patterns as shown below.
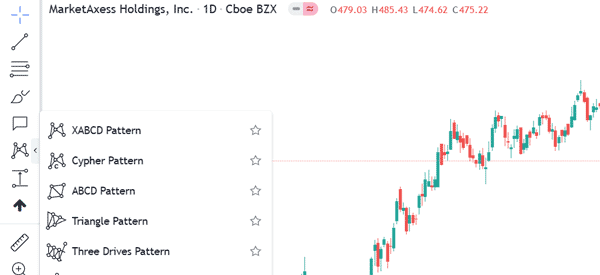
These tools are just the beginning. Instead, you need to spend a lot of time learning how to identify the points and how to draw them. Therefore, harmonic patterns are mostly used and recommended for advanced traders who have some experience in trading.
Another important aspect of harmonic patterns is that they can be applied on all types of charts. It is possible to identify them on as short as a three-minute chart and as a long chart like a weekly one.
How harmonic patterns work
As we have written before, the financial market is usually driven by emotions. Both experienced and inexperienced traders enter the market by conducting an analysis on charts and identifying positions. This is the main reason why unique patterns like triangles and head and shoulders patterns form.
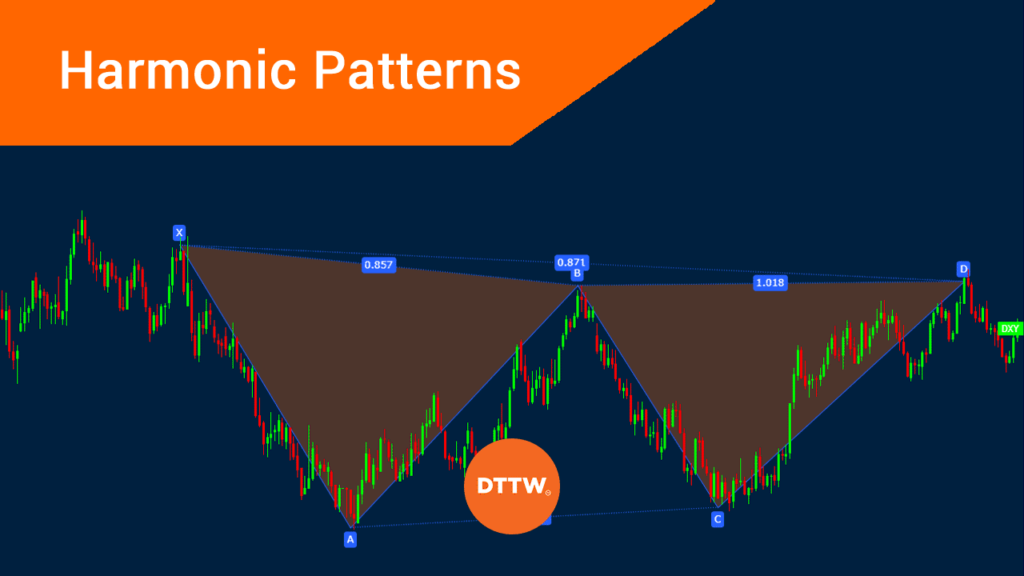
Therefore, when you look closely at a chart pattern, you can identify these patterns. For example, you could identify that a harmonic pattern like Cypher or XABCD has formed.
It is worth noting that these patterns don’t tell traders when to buy or sell an asset. Instead, they show them the probability that a trade will either make a reversal or continue in a given direction.
Practical example
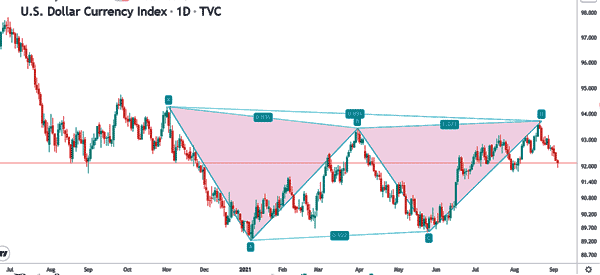
The chart below shows the US dollar index. In it, we have used the XABCD pattern mentioned above. As you can see, the dollar index declined sharply after it reached the D level. Now, in this case, the trader could place a sell trade and benefit as the price drops.
Still, in this case, you could have also used other strategies to identify the take-profit levels. You could also use technical indicators to know when to exit the trade.
Examples of harmonic patterns
There are several types of harmonic patterns in the financial market. Let’s see the most important and useful ones that you can use in your chart analysis.
The ABCD pattern
This is one of the simplest pattern to identify. It is identified by having three movements and about two points. It has an impulsive pattern known as AB. This is followed by a corrective pattern known as BC and another impulsive pattern that is known as DC. In this case, the entry point is mostly closer to the C point.
BAT pattern
As the name suggests, the BAT pattern is shaped like a real bat. The pattern is similar to the ABCD pattern mentioned above. But it also adds another section known as XA. Here, the XA section will lead to a BC retracement pattern. The CD will then retrace to the BC level while the endpoint will be D.
Gartley pattern
The Gartley pattern is similar to the BAT or XABCD pattern. The difference is that the retracement of point B should be about 0.618 of XA. Also, the retracement of D must be 0.786 of XA. In this case, the stop loss of a trade is usually placed at point X.
Butterfly pattern
As the name suggests, the butterfly pattern resembles a real butterfly. It has XA, AB, BC, and then CD levels. In this, the most important point is that the 0.786 retracement of the XA leg.
Crab pattern
This pattern was developed by Scott Carney. This pattern follows the XA, AB, BC, and CD pattern, which identify extreme levels.
The shark pattern
This is another pattern that was developed by Scott Carney. It is a five-leg reversal pattern that is labelled as O, X, A, B, and X.
Summary
The concept of harmonic trade patterns is a relatively wide one. One that is difficult to handle in a single article. Therefore, we recommend that you spend a lot of time learning about it and testing its key approaches.
External useful Resources
- The 5 Problems With Harmonic Trading And How You Can Fix It – Trading with Rayner
