Price action is an important concept in trading. It is a method of trading where participants focus mostly on how an asset is trading. They ignore other concepts like technical indicators and fundamental analysis.
In price action, traders look at the direction an asset is trading in and how it is trading. This is because they believe that how an asset is trading can help them predict the future.
In this report, we will focus on the head and shoulders pattern, which is a very common price action strategy used by traders. And maybe one of the best way to identify a reversal in charts.
Related » Volume Price Analysis in Trading Strategies
What is the Head and Shoulders Pattern?
This is a pattern that traders use to find reverse and reversal. The pattern happens when the price of an asset is in an uptrend. When it completes, the pattern is usually the begin of a new downward trend.
The pattern is formed when there are three peaks during an uptrend. The middle of the three peaks is usually taller than the two others.
As a result, it paints an image of how a person looks like. The head of a person is usually at a higher level than the shoulders. A good example of how this forms is shown on the chart below.
The head and shoulders pattern is part of what are known as reversal patterns. The others are a double or triple top, hammer, bullish and bearish engulfing, doji, and a rising and falling wedge pattern.
The opposite of a reversal is a continuation pattern. Some of the popular continuation patterns are ascending and descending triangles, bullish and bearish flags, and bullish and bearish pennants, among others.
Is this tool bullish or bearish?
The head and shoulders pattern is usually a bearish sign. This means that when it happens, it usually sends a signal that the price’s bullish move will soon turn bearish.
On the other hand, when the head and shoulders happens after a bearish trend, it sends a signal that bears are losing momentum. This typically leads to a new bullish trend.
Head and shoulders formation
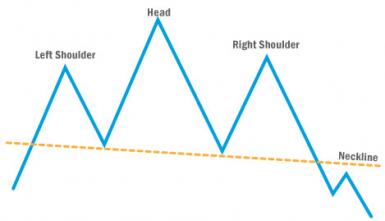
The head and shoulders pattern form in a very simple way. This is summarized in the image above. Here are the important parts of this pattern:
- Previous trend – First, there must be an initial upward trend for the price action to be formed. Without this, the head and shoulders formation cannot be formed.
- Left shoulder – This is the initial peak of the head and shoulders pattern. This happens when in an uptrend, the price forms a small downtrend.
- Head – After the initial downtrend, the price recovers and starts to rally again. The rally stays for a while and raises above the left shoulder.
- Right shoulder – When the head is formed, the asset then declines. The decline then leads to another upward trend, which reaches the same level as the left shoulder.
- Neckline – The neckline of the pattern is formed by connecting the lower parts of the left shoulder, head, and right shoulder. This neckline does not need to be horizontal. It can slope up, slope down, or be horizontal.
- Volume – Volume is usually an important thing in head and shoulders pattern. Changes in volume can tell whether the pattern is actually forming or not.
Important note: In this pattern, the price must move below the neckline to complete
What does the head and shoulders pattern tell you?
The H&S pattern tells traders that the bullish trend is losing its momentum. Specifically, it says that the the price found its initial resistance, say at $10, and then declined to a certain support level.
It then bounced back and went above the first resistance and then struggled to move above it. Again, the price moves to the support and then found another resistance at the same price as its first resistance. Therefore, the takeaway is simply that the bullish momentum is fading.
The opposite is true with the inverse head and shoulders pattern. The pattern usually says that the bearish trend is losing momentum.
Why the neckline is important
The neckline of the head and shoulders pattern is very important because it provides evidence that the pattern is indeed head and shoulders.
Another reason is that it helps to determine the potential profit target for the asset. Most traders estimate the target by measuring the distance between the head and the neckline.
Inverse Head and Shoulders Pattern
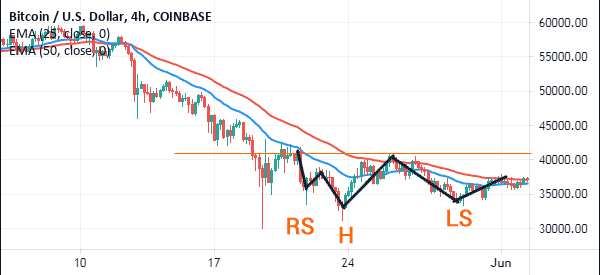
The inverse head and shoulders pattern is the exact opposite of the head and shoulders. The key parts we described above are usually the same. However, the difference is that in the inverse, the initial trend happens when the price is moving lower.
A good example of the inverse or inverted head and shoulders pattern is in the chart below. The chart shows that the Bitcoin price declined to $30,000, which became the head. It also formed two shoulders. Therefore, while the bullish breakout has not happened yet, there is a possibility that the cryptocurrency will break out higher.
Head and Shoulders Chart Analysis
There are a few steps you need to take when using the head and shoulders pattern.
First, you need to look at the chart of the asset you are trading. Look at the stage that it is in. As such, it is very difficult to look at it when it is on the left shoulder and the head.
Instead, you should look at a chart with a left shoulder and head. You should then look at how it moves next. You should draw a neckline and wait for the right shoulder.
After this, you should wait and see whether it moves below this line or not. If it moves back, you should also wait to see where it reaches. Finally, any move below the neckline should be indicative of further drops.
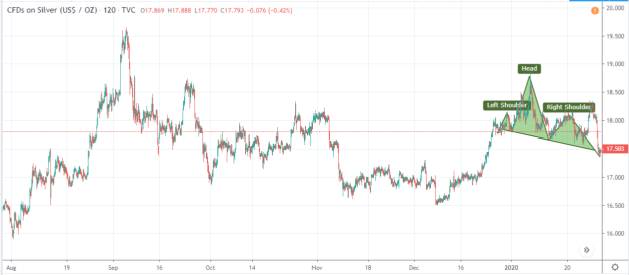
You can draw these lines using the tools that are provided. The TradingView platform provides a head and shoulders tool. A good example of this is shown on the silver chart that is shown below.
Head and shoulders trading strategy
The head and shoulders pattern trading strategy is a bit simple. In most cases, traders place a sell-stop below the neckline and then estimate the take-profit by measuring the distance between the head and the neckline.
The stop-loss is then placed at the right shouler. This is usually a relatively safe approach considering that it is difficult to estimate where the right shoulder will move to.
H&S pattern in stocks trading
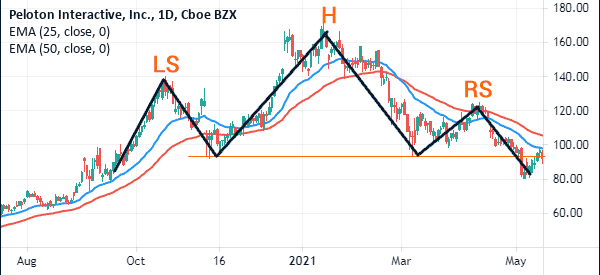
Like other chart patterns, it is possible to use the head and shoulders to trade stocks. A good example of this is in the Peloton stock that is shown below. As you can see, the stock rose to $140 and then pulled back to $93.
It then rose to $170, forming the head section. The stock then rose to $125 and then formed the right shoulder. Therefore, in the longer term, there is a possibility that the stock will break out lower.
Summary: Is the head and shoulders a reliable pattern?
The head and shoulders pattern is a common one among chartists. It is easy to work with, and is ideal for identifying reversals. It’s also one of the most reliable patterns in the market. It specifically works best when it is combined with other technical indicators like volume and moving averages.
As a trader, we recommend that you take your time to learn more about it. Also, learn about how you can use volumes to confirm it and whether you can use any indicators to confirm the trends.
External Useful Resources
- Keys to Identifying and Trading the Head and Shoulders Pattern – Forextraininggroup
- Trading ideas about H&S – Tradingview
