Heikin-Ashi is an advanced chart used in the financial market. The term heikin means average in Japanese while ashi means pace. Subsequently, the chart means the average movements of prices.
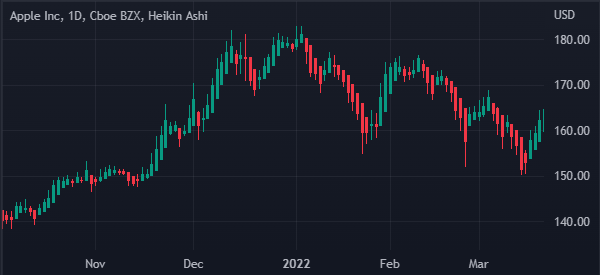
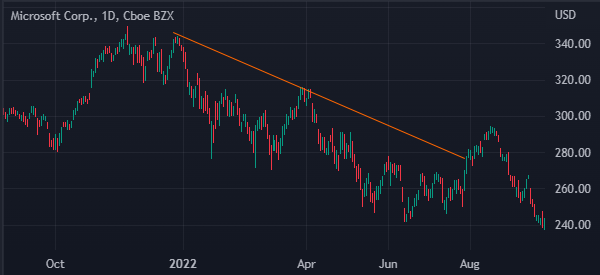
When applied, the chart shows a close resemblance to the popular Japanese candlestick patterns. In reality, like we will explain below, they are usually different. The chart below shows how the Heiken-Ashi chart looks like.
How to interpret and calculate the Heikin-Ashi
This type of candlestick can tell you several things!
First, a long and hollow candlestick tends to show that there is a lot of buying pressure. Second, if the candlestick lacks a lower shadow is usually a sign of the strength of the price movement.
Third, if there is a long filled (or red) candlestick, it is usually a sign of more selling pressure. Finally, a tiny Heikin candle and that with a long upper and lower shadows is a sign of indecision in the market.
Heikin calculation
To be fair, the Heikin-Ashi is relatively complicated to develop, which is probably the reason why most people don’t use it.
Also, if you want to use it, it is already provided in some trading platforms like the TradingView. You can also download and install it for other trading platforms. Therefore, you don’t need to calculate it manually.
The first step to calculate the Heikin-Ashi is to find the average of the open, high, low, and closing prices. The open is calculated by finding the average of the previous Heikin-Ashi candlestick and the close of the previous candlestick.
On the other hand, the high is the highest of the three data points. That is the current period’s high, current open, and the current close. Similarly, the low is the lowest of the three data points.
How to trade with the Heikin-Ashi Candlestick patterns
There are several strategies for using these candlesticks. We recommend that you choose the one that best suits your trading style and do some backtests.
Traditional candlestick patterns
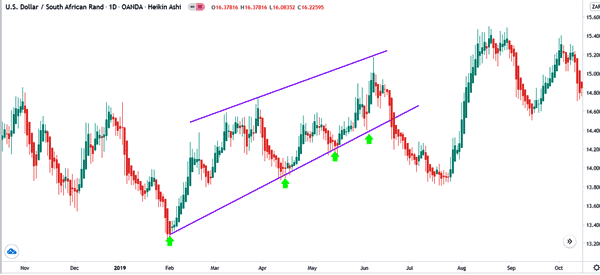
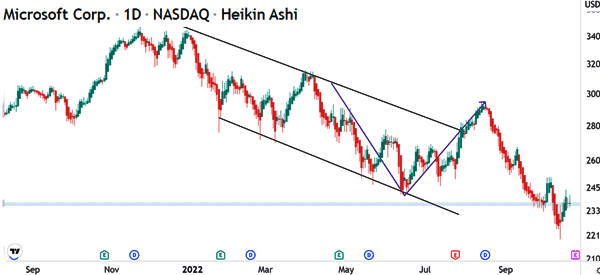
First, you can focus on the traditional candlestick patterns like triangles, pennants, channels, and flags. Channels are popular and are usually drawn by connecting high swings and lower swings.
The goal of this strategy is to buy at the support and short at the resistance level, as shown on the chart below.
Breakouts
Similarly, you can trade breakouts using Heikin-Ashi. After all, channels don’t last forever. In the chart above, you could short the USD/ZAR and ride the bearish trend once it moved below the level of resistance.
A breakout happens after a financial asset spends some time in a consolidation phase or when it is forming a certain pattern like a triangle, rectangle, and a rising wedge. In most cases, a breakout will often see a price continue in the new direction. However, in other cases, it can develop to form a false breakout.
A good example of how to trade breakouts using Heikin-Ashi is shown in the chart below. As you can see, the price is trading in a tight range that is shown in black. This range is between 6,896 and 6,960.
Therefore, in this case, traders can use different approaches to trade this breakout. A popular method is to set a sell-stop below the lower side of the channel and a buy-stop above the upper side of the channel.
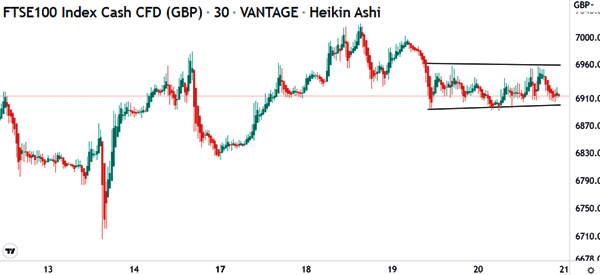
These stops will be initiated once the breakout happens. The only risk of this strategy is that a false breakout can happen after the breakout happens.
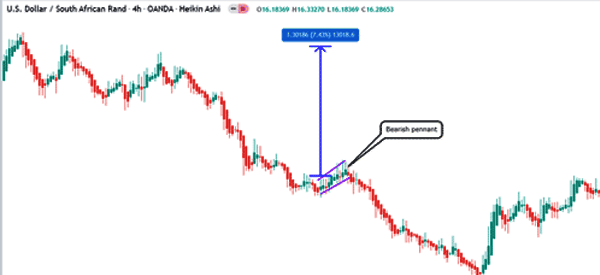
Bearish Flag
Another candlestick pattern you can use is the bearish flag. This happens during a downtrend, when the rally pauses and forms what seems like a parallel channel. This is shown in the chart below.
What are the best Indicators to use with Heikin Ashi?
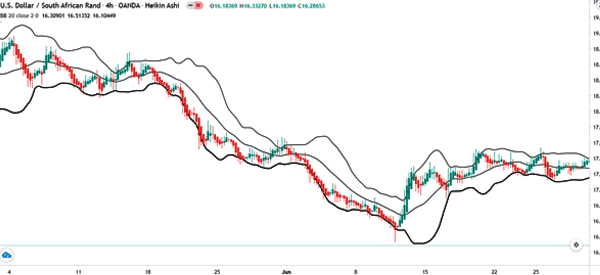
Another approach of using the Heikin-Ashi is to use technical indicators like the moving averages, Bollinger bands, and the Relative Strength Index (RSI). The idea of using these indicators is similar to how they are used in traditional candlestick patterns.
For example, in the chart below, we have applied the Bollinger bands. The indicator is simply a 20-day simple moving average with 2 standard deviations. Therefore, in a strong downward trend, the price will remain along the lower band.
At the same time, if it crosses the middle line, it can be interpreted as the start of the reversal.
Heiken Ashi vs Candlesticks
A common question is on the difference between Japanese candesticks and Heiken Ashi. This question is asked because the two charts have a close resemblance.
Before we look at these differences, let us look at the two charts below. The first one shows a Heiken Ashi chart while the next one shows a candlestick chart.
Below is a candlestick chart
As you can see, these charts have a close resemblance. However, the Heiken Ashi one has filtered some noise and smoothed key moves. For candlesticks, candles usually move from one color to another, which makes them a bit hard to interpret.
On the other hand, the Heiken Ashi typically filters the noise by having similar colors follow each other. As such, colors remain green during an uptrend and red during a downtrend.
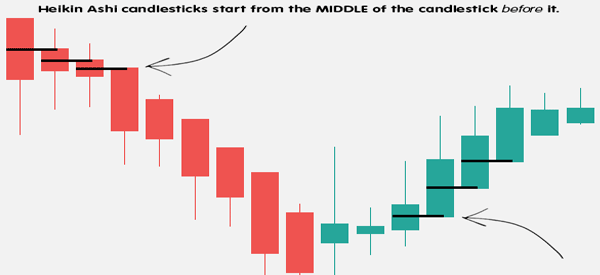
Another difference between the two is where candles start. In a candlestick, the next candle starts from where the other one ended. With Heiken Ashi, candlesticks start at the middle of the candle before it.
Heiken Ashi trading strategies
There are several strategies to use Heiken Ashi. Most of the are similar to those of using candlestick patterns. Let’s see the most common examples of these patterns.
Trend-following
The best and most common Heiken ashi trading strategy is trend-following. This is a strategy that involves buying when the candles are green and moving upwards and shorting when the candles are red.
A trader can use trend indicators to determine when the trend is about to end. A good example of this trend-following is shown in the chart below.
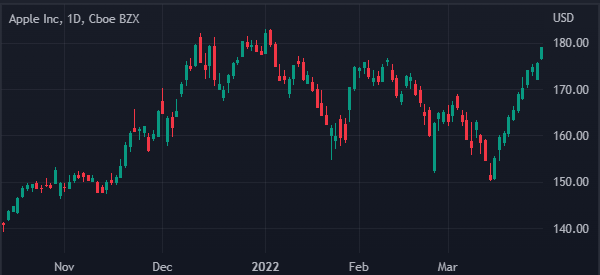
Reversals
A reversal happens when a bullish or bearish trend suddenly turns around. There are several ways of identifying these trend reversals. For example, you can look at patterns like a hammer, shooting start, or a morning star. Also, you can look at chart patterns like triangles and ascending triangles.
In the chart below, we see that the stock was in bearish trend. This pattern then experienced a trend reversal when it dropped to the lower side of the channel.
Final thoughts
Heikin-Ashi is not a popular chart system. But it is also an easy one to use if you have a good understanding of how the traditional candlesticks work.
If this is your first time hearing about them, the right thing you need to do is to study them, practice, and backtest your trading strategy.
External Useful Resources
- How to Use a Heikin Ashi Chart – Babypips
