Spoiler: a lot. Trends play an important role in the financial market as they form the best opportunity for one to make money. Besides, the goal of any trader is to find a trend early and then ride it to the very end.
In this article, we will look at the concept of highs and lows in the market and how to use them in day trading.
52-week high and low
What is a 52-week high?
A year has 52 weeks. Therefore, investors and traders pay close attention to an asset’s range within this period. In this case, they look at where an asset is trading within this period and make decisions on whether to buy or sell it.
52-week high is an important level to watch because it shows you trades that are having a bullish momentum. In most cases, traders follow the momentum by buying an asset whose price is rising. In other periods, they wait for these assets to have a reversal.
What is a 52-week low?
The opposite of a 52-week high is a 52-week low. It is an equally important thing to watch since it shows you companies that are having a bearish momentum. In most cases, traders either place short trades on assets that are reaching their 52-week lows or wait for their reversals.
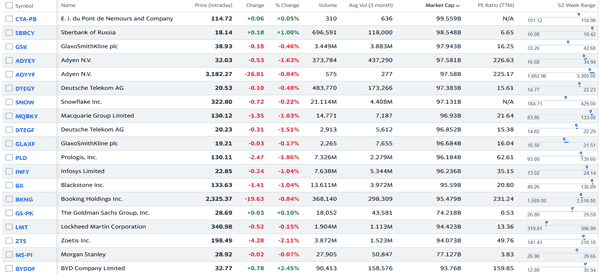
Most companies like WeBull and Investing.com usually have a feature that summarizes 52-week high and lows. The chart below shows shares that are reaching their 52-week lows at the time of writing.
Higher highs and higher lows
Another important concept in trading is known as higher highs and higher lows. It is a useful concept that is used on a daily basis when doing analysis.
Most importantly, it is widely used in trading during a period when an asset is in an uptrend. Further, these charts are mostly used in candlestick analysis. It is almost impossible to identify the two when using a line chart.
When an asset is in an uptrend, it is usually not a straight line. It usually has some pullbacks, which happens as the rally takes a breather. Now, the upper peaks of this trend are known as higher highs. On the other hand, the lower sides of the uptrend are known as lower highs.
In the chart below, we see that the higher highs are indicated in red arrows while the lower highs are shown in blue.
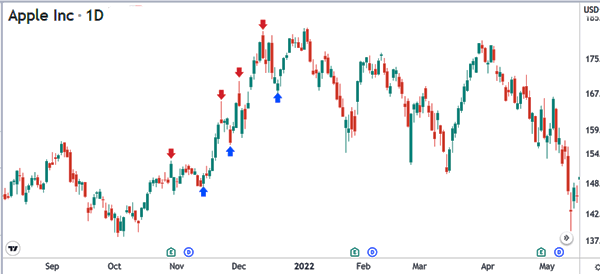
A higher-high happens when an asset’s price closes at a higher price than it did on the previous day. In a hourly chart, a higher high is when the asset’s price closes at a price that is higher than in the previous hour.
A higher low happens when the price closes at a lower level but when the low is higher than the previous session’s low.
What is a lower high and lower low?
The opposite of a higher high is known as a lower low. It happens during a downtrend when the price of an asset closes at a lower price than it did at the close of the previous day, which was also a low.
A lower high, on the other hand, is a situation where the price of an asset closes at a high price that is lower than the high in the previous day or candle.
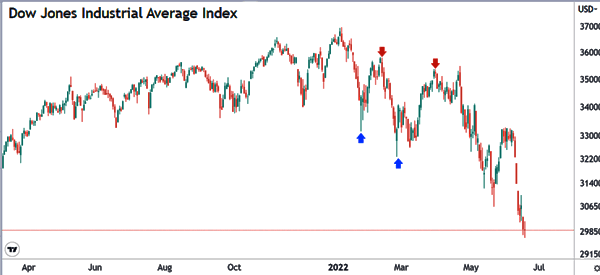
When a lower high and a lower low happen, it is usually an indication that the downtrend is strong and that the price will continue falling. The chart below shows how a lower high and a lower low looks like.
How to trade these lows and highs
With the understanding of these higher highs, higher lows, lower lows and lower highs, the question then is how to trade the two.
Have a clear picture of the market
First, understand the bigger picture in the market. This means that you should assess why the asset is moving in that direction.
If it is in a strong downward trend, figure out why that is the case. There are several potential causes for that. For example, shares can form a series of lower lows and lower highs when the Fed shifts its strategy to hawkish and vice versa.
Stocks can also decline because of weak earnings, thinning margins, and change of a company’s management. On the other hand, they can form a series of higher highs and higher lows when the outlook is strong.
Using trend indicators
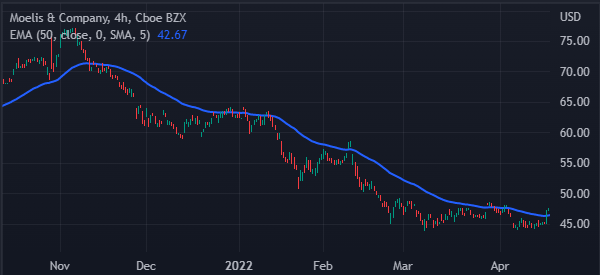
Second, it is recommended that you use trend indicators like moving average and Bollinger Bands. In the chart below, we see that the stock is forming a series of lower lows and lower highs. It is also staying below the 50-day moving average.
Therefore, in this case, you can short the stock as long as it is below the MA.
Incorporating Fibonacci retracement
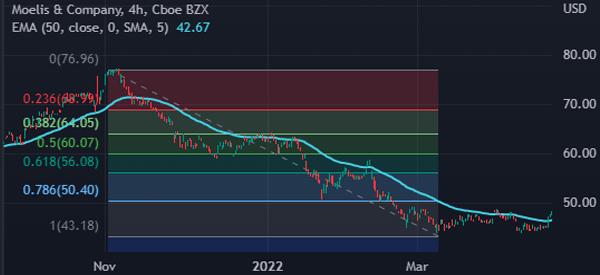
The next key approach is to use the Fibonacci retracement to identify support and resistance levels. The retracement will help you identify key support and resistance points. In most cases, an asset will oscillate at the key Fibonacci retracement levels.
Buy the dip or sell the rip
Another popular approach is to buy the dip and sell the rip. Buy the dip is a strategy where a trader buys the dip during an uptrend. In most cases, buying the dip is a good strategy during an uptrend while selling the rip is a good strategy during a downtrend.
Summary
In this article, we look at what higher highs, higher lows, lower highs, and lower lows in the market. We have also identified some of the most important trading strategies to use when using them.
External useful resources
- A stock making lower highs and higher lows is going into a downtrend or up trend (bull or bear?)? – Quora
