Volatility is an important concept in the financial market. It refers to the overall rate of change in prices of assets like stocks, commodities, cryptocurrencies, and forex pairs.
When the rate of change is faster, then it means that an asset is highly volatile. On the other hand, an asset that has a low rate of change means that it is not volatile.
Historical volatility is defined as the rate of dispersion of a financial asset over a certain period of time. In other words, it looks at how a price is deviating from the average. The most popular approach to find historical volatility is using standard deviation, which is a popular mathematical calculation.
What is volatility?
The concept of volatility is important in the market. As an example, most investment banks like Goldman Sachs and Morgan Stanley recorded substantial trading profits in 2020 amid the global pandemic.
This happened since 2020 was one of the most volatile years in the recent past because of the risks brought about by the pandemic. On the other hand, these companies tend to make less money in periods of low volatility.
»Low Volatility: How to Day Trade Profitably?«
What is historical volatility
As mentioned in the introduction, the concept of historical volatility is relatively simple. It simply looks at how an asset is volatile at the moment and then compares it with the historical average.
There are several approaches to look at this concept. For example, in a trending market, a trader can look at the present price and conduct a standard deviation calculation.
In other periods, a trader can look at the present price and add a moving average to see how close or how far it is. As such, this can be a way of looking at whether an asset is overvalued or undervalued. Historical volatility is also known as statistical volatility.
Related » How to use historical data
What is the difference between historical and implied volatility?
There are generally two main types of volatility that you need to know about. First, there is historic volatility, which refers to how a price deviates from its past overall price in a certain period of time.
Second, there is implied volatility, which basically looks into the future and how volatile a stock could become. This IV is mostly useful in the options trading industry.
Traders use implied volatility to predict how an asset will be in the future. For example, if you buy a stock, you could use implied volatility concepts to anticipate future moves.
For example, for stocks that don’t show a lot of volatility, looking at their implied volatility will help you predict your profit or loss. It will also help you to set your stop-loss and take-profit.
There are several factors to consider when looking at implied volatility like supply and demand of an asset.
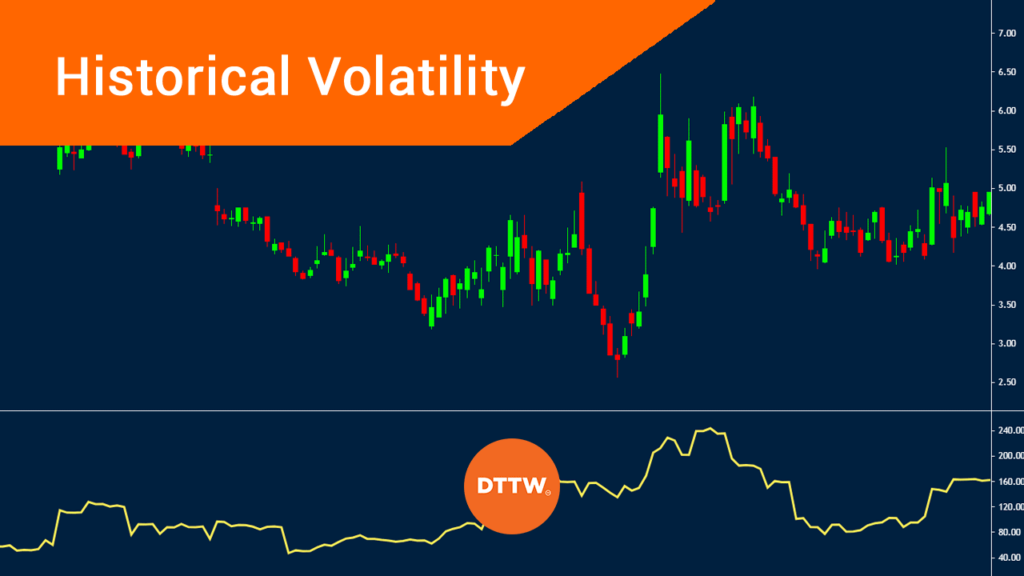
What is the Historic volatility indicator?
To measure the historic volatility, day traders use an indicator known as Historic volatility that is built-in the TradingView platform. One can also download and install the indicator in other platforms like the MetaTrader.
When applied, the indicator is simply a line that moves up and down.
The historic volatility is a relatively difficult indicator to calculate. However, like all indicators, it is not always necessary for you as a trader to know how it is calculated. All you need to know is how to apply it in a chart and predict the future price.
The formula for calculating the Historic volatility is as shown below:
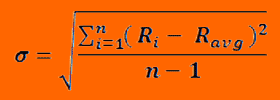
In this formula, R sub i through n is the continuously compounded return for each period. R avg, on the other hand is the average of the daily returns.
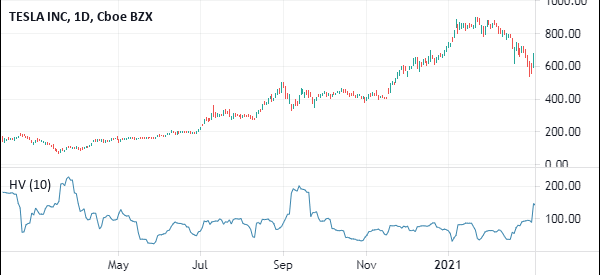
The chart below shows the Historic volatility applied in the daily chart of Tesla.
How to use the Historic Volatility indicator
The HV indicator is unlike other indicators that we have looked before. Unlike indicators like the moving average and Relative Strength Index (RSI), the Historic Volatility indicator does not tell you when to buy or sell an asset. It does not also identify overbought and oversold levels.
Instead, the indicator is merely a guide of what is happening in a financial asset.
For example, if the HV rises, it means that a company’s stock or currency is getting highly volatile. Therefore, as a trader, you should dig deeper into the firm and see why this is happening.
You can achieve this by looking at the recent news from major sources like Bloomberg and Yahoo Finance. After this, you can use this knowledge to make better decisions on whether to buy the stock or short it.
»Breaking News vs Price Action«
Combine it with other indicators
Most notably, you should always use this indicator as a complement to other indicators. Most traders use it in addition to indicators like the Average True Range (ATR), Bollinger Bands, and moving averages.
You should also use it as a guide when trading using price action strategies like triangles and bullish and bearish flag patterns, among others.
Alternatives to Historic Volatility
Because of how volatility is to traders, there are other popular alternatives to the Historic Volatility indicator. Some of the most popular ones are:
- Standard deviation – The standard deviation is a popular trend indicator that measures how widely prices are dispersed from the average price. If the price is in a range, the standard deviation tends to be relatively low.
- Average True Range (ATR) – The ATR indicator is calculated by looking at the simple moving average of a series of true range indicators. It is the most popular volatility indicator.
- Bollinger Bands – Bollinger Bands are popular indicators that find the positive and negative standard deviations of the moving average. It is made up of three lines, with the middle one being the moving average of the asset.
- VIX index – The CBOE volatility index is a broad measure of how volatile the S&P 500 is. It does this by compiling data in the options market.
How reliable is historical volatility?
Historical volatility is an indicator that is mostly used by long-term investors. In our experience, we find it to be relatively ineffective tool to use in the market. This means that it rarely identifies buy and sell points.
However, options traders find the implied volatility indicator to be a better tool to use.
Final thoughts
In this article, we have looked at what Historic Volatility is and how you can use it in the financial market. While it is not a popular indicator, you can use it to find the trend in the volatility of the asset you are trading.
External Useful Resources
- How Do You Calculate Volatility in Excel? – Investopedia
