Trading breakouts is an excellent trading strategy that involves buying or selling an asset after a long period of consolidation. Most successful day traders know how to identify these breakouts and ride the new trend until the next trend is formed.
However, the biggest risk of trading a breakout is when the price suddenly reverses, in what is known as a false breakout. In this report, we will look at what false breakouts are, how you can identify them, and how you can use them in the market.
What is a false breakout?
At times, a financial asset like currency pair, commodity, exchange-traded fund (ETF), and stocks trade within a narrow range. During this period, they form a parallel support and resistance level.
In this case, a trader can make money by buying at the support and shorting at the resistance. However, always, it reaches a point where the price breaks either the support or the resistance and starts a new trend.
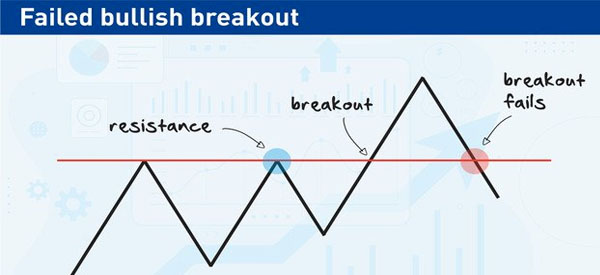
A breakout is when it does this. However, at times, after the breakout, the price tends to reverse. This reversal is known as a false breakout. A good example of a false breakout is shown in the chart below.
How it appears in charts
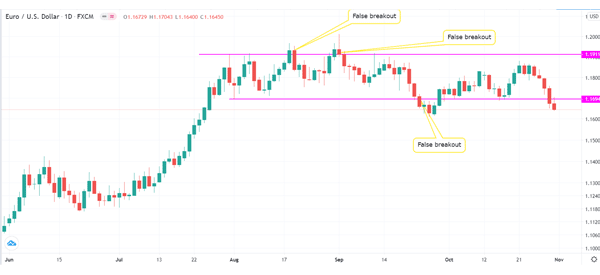
In the chart below, we see that the EUR/USD pair was in a relatively narrow range, with parallel support and resistance levels. We also see that there were at least three false breakouts when the channel was being formed.
Why do (and when) False Breakout happens
Ideally, a false breakout happens when there are no enough bulls or bears to continue supporting the asset. In the example above, the lower false breakout happened when bears found strong resistance from bulls.
Similarly, the upper false breakouts happened because there were no enough bulls to continue pushing the price higher.
There are two primary types of a false breakout:
- Bull trap – This happens when the price crosses a key resistance and then pulls back after a short while.
- Bear trap – This happens in a bearish trend when the price moves below a key support and then returns to the channel.
How to identify a false breakout
To be fair, identifying false breakouts is never easy. If it was, most day traders would be able to identify it and make more money. However, there are several approaches you can use to avoid being caught-up in such a situation.
Wait some days + 3% rule
First, you need to wait for a few days to confirm whether what has happened is a real breakout. While doing this may seem like a counterproductive thing to do, the reality is that it will see you avoid losing money through a false breakout.
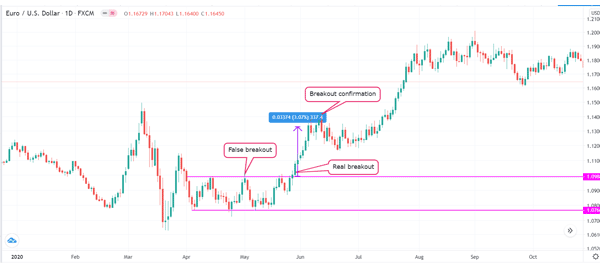
To do this, traders use the 3% rule, which means that the price needs to rise above the resistance level by 3% to confirm a breakout. A good example of this rule at work is shown below.
Look different timeframes
Another strategy of identifying a false breakout is looking at other timeframes. Ideally, if you spot a breakout in a shorter timeframe chart like four-hours, you can extend it to daily or weekly chart and see the overall trend.
If the price breaks down in a smaller timeframe chart but not in a longer timeframe chart, you can call this a false breakout.
Related » How to perform Multi time frame analysis
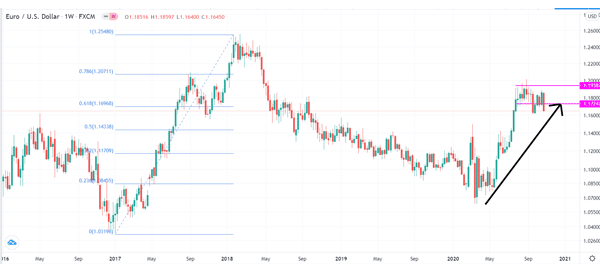
For example, in the first picture above, we see the EUR/USD attempting to break out lower on the daily chart. But, on the weekly chart, we see it still in consolidation – bullish flag – after a bullish run.
Also, we see that the price is between the 61.8% and 78.2% Fibonacci retracement level, which is a sign that bulls have just paused. This can be a sign that the lower breakouts are not real.
Using MACD
A common question is on how to use the MACD indicator to identify a false breakout. In all fairness, the MACD is not the best indicator to identify these breaouts. Indeed, no indicator is perfect for handling such a false breakout.
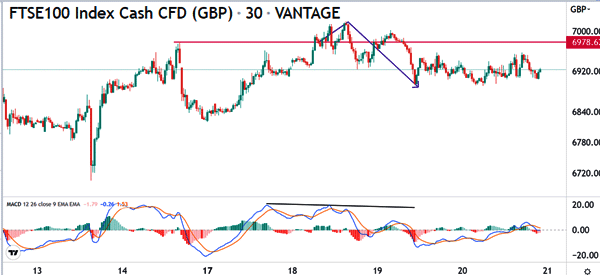
One way that traders use is to identify a divergence with the MACD. Divergence happens when an asset’s price and the overall trend of the oscillator are moving in opposite directions. This divergence is shown in the chart below.
How to avoid a false breakout
A common question among many traders is how to avoid a false breakout. There are several approaches to use.
Embrace patience
First, you should be patient whenever you see a breakout happening. Instead of opening a trade right away, wait for a confirmation signal and then enter a trade.
Depending on your trading timeframes, this waiting process can take a substantial amount of time. For example, if you are trading on a 1-minute chart, you just need to wait for a few minutes to confirm this. On the other hand, if you are trading on a daily chart, you should wait for a few days.
Stops
Second, always protect your trades using a trailing stop-loss or a fixed stop-loss and a take-profit. These tools will stop your trades when the trades reach pre-determined levels and protect you from major drawdowns.
Other strategies
Third, use charting tools to identify false breakouts. Some of the popular tools that can help you on this are Andrews Pitchfork and Fibonacci Retracements.
Finally, always focus on the asset’s volume. In most cases, a false breakout happens when it happens in a low-volume environment.
Throwbacks after breakouts
A throwback after a breakout is a topic that is widely covered in the bank trading strategy. The idea is that an asset will have a breakout and then see a strong move in the opposite direction.
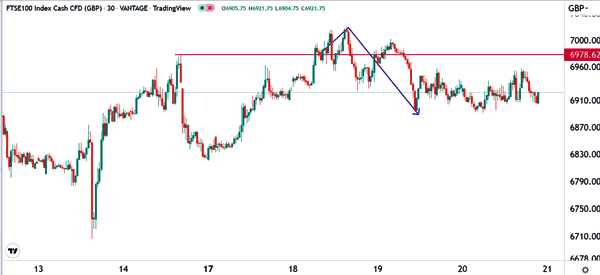
A good example of this is shown in the FTSE 100 chart below. As you can see, the index made a bullish breakout above the resistance at 6,978. To many traders, that could have meant that the bullish trend was continuing.
However, the index made a sharp turnaround and dropped to below 6,900.
It can often be difficult to handle a throwback after a breakout. Two tips to use is to always wait before you open a trade after a breakout and to check out the volume. If a breakout happens in a low-volume environment, there is a high chance that a reversal will happen soon.
Final thoughts
False breakouts happen all the time in the financial market. Whenever they do, most traders who don’t know much about them tend to lose a lot of money. Unfortunately, identifying these breakouts is not an easy task.
However, following the strategies we have mentioned can help you avoid making these mistakes.
External Useful Resources
- False Breakout Strategy: A Simple Yet Powerful Approach – DailyPriceAction
- Avoid the Trading Trap of Fake Reversals with Ichimoku – DailyFx
