Trading in the financial market is one of the most interesting things you can do. This is mostly because of the number of market forces that affect the movements of the financial assets.
Every day, new information is released in the market that ends up affecting the markets themselves. For example, today, investors might be worried about inflation while tomorrow, they will be excited about jobs numbers.
In other words, no single day is usually similar to another one.
In several occasions, a market rally can lead to a market crash. To investors, the fear of market crashes is usually real. This is because they tend to lose money when this happens.
On the other hand, for traders, a market crash is usually not all that problematic. This is because they are usually flexible about exiting their positions when things start to change.
Related » When to enter and exit a position
A Market Correction could destroy your Day Trading dream. This is why is so important to know How to Approach it.
As a trader, how do you know when a market correction is about to happen?
A market correction refers to a period when the overall market or a financial asset suddenly dips. In most cases, a real correction happens when a financial asset drops by more than 20%.
A market correction happened in the United States during the dot com bubble, the Global Financial Crisis (GFC) and in 2020, when the World Health Organization (WHO) declared coronavirus a global pandemic.
In that period, other financial assets like silver, crude oil, and many stocks went into a correction.
How to identify a market correction
It is relatively easy to identify a market correction. In most cases, a real correction happens when a major index like the Nasdaq 100 or Dow Jones drops for a few days or weeks. For a correction to happen, it needs to drop by 10% from its highest point and its lowest level.
A correction differs from a bear market, which happens when the asset crashes by 20% from its peak. Some tools like TradingView have simple drag-and-drop tools to measure this distance.
Ok. Now we’ll look at the popular causes of corrections and how you can predict when one will happen.
Causes of corrections
There are many causes of corrections. Some of them are:
- Weak corporate earnings – At times, a stock will move to a correction when it reports weak quarterly earnings or guidance.
- Weak macro data – Some assets tend to move to a correction when there is weak economic data. For example, if a country reports weak GDP numbers, its currency could move into a correction.
- Supply issues – At times, supply and demand dynamics tend to go into correction when there are demand and supply dynamics.
- Technical reasons – At times, a financial asset could move into correction because of technical reasons such as when it is in an overbought level.
How often do market corrections happen
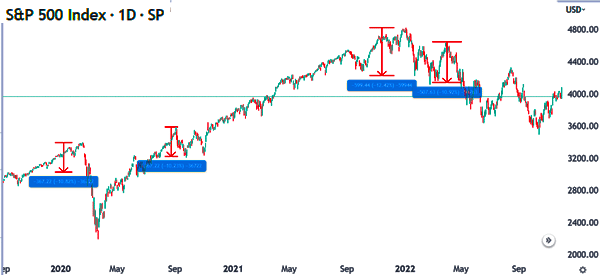
For the broader market, corrections in key indices are relatively common. As shown below, the S&P 500 went through several corrections between 2020 and 2022.
Among individual stocks, these corrections tends to be more popular. While corrections are common, bear markets, when assets drop by over 20%, are relatively rare.
How to predict when a correction will happen
To be fair. It is always impossible to predict when a correction will happen. However, there are some simple strategies that can help you identify when these corrections are about to happen.
Yield curve
A yield curve refers to the overall movement of short and long-term treasury bonds. In a normal situation, the yield of a long-dated bond will be higher than that of a shorter bond. That’s because, the extreme future is relatively difficult to predict.
Therefore, when the situation changes and the curve inverts, it usually sends a signal that a correction is near. For example, the curve inverted in 2018 leading to a major correction in 2020.
Fear and greed index
The fear and greed index is a tool developed by CNN Money. The tool is a combination of various indicators in the market like the VIX, breadth indicators, and junk bond demand, among others.
The index ranges between zero and 100. A sign of a correction happens when the index moves close to 100 because it sends a signal that there is substantial greed in the market.
Irrational exuberance
Another sign that a correction is about to happen is a period of irrational exuberance. Before the dot com bubble, the valuation of of tech companies was beyond reasonable. Similarly, before the 2008/9 financial crisis, shares of banks was also at extreme levels.
At the time of this writing (end of 2022), some stocks are at extreme levels signaling that a correction may happen.
As We have written before, volume is often the most important thing that many novice traders ignore.
Next, you should look at the oscillator indicators.
How to Use oscillator indicators to forecast a market correction
These are indicators like the Relative Strength Index, Stochastic, Bulls and Bears Power among others.
These indicators help traders know when the financial instruments are overbought or oversold. When assets are overbought, it means that traders could start taking profits which could push the prices lower.
The RSI is the most commonly used indicator in this.
Another way to know when a crash is coming is to look at the earnings of major companies. During the earning season, traders watch out for key financial data such as revenue and growth.
When certain important companies report weaker finances, the implications could be major. For example, the crash of 2008/9 happened partly because of the financial difficulties facing Lehman Brothers.
When this happened, traders thought that other financial companies would face such problems.
As We mentioned above, the fact that you are a trader is better for you. This is because unlike long-term investors you don’t have any obligation to keep holding a losing trade. You can exit a long trade and initiate a short trade and benefit as the price comes down.
Still, it is usually very difficult to predict when a crash is coming. However, you can use these strategies to help you make informed decisions and anticipate a crash.
Is it wise to trade during a correction?
A correction is a perfect time to day trade and the worst period for long-term investors. Traders can make money during correction by shorting the stocks that are falling. Shorting is the process of betting that a stock will drop by borrowing, selling, and then buying again the stock.
The only risk for shorting stocks is being caught in a short squeeze. This happens when a stock you have shorted reverses and goes parabolic. The risk of such a situation is that the maximum loss you can make when shorting is infinite since a stock has no limit of how high it can go.
How to protect yourself from market corrections
There are several strategies that you can use to stay safe from market corrections. Some of these approaches are:
- Having a trailing stop-loss – This is a tool that will automatically stop your trade when it falls to a certain point. It differs from a standard stop-loss in that it moves with the asset. As such, if there is a sharp reversal, your initial profits will be protected.
- Don’t leave trades open overnight – Closing all your trades by the end of the day will help to protect you from opening gappers.
- Limit your leverage – Reducing the amount of leverage you use will protect you from significant losses.
- Don’t go against the trend – While fading the trend is a good strategy, it can lead to significant losses.
- Do your research – Avoid FOMO and do your own research before buying an asset.
Correction vs crash
A correction is often used interchangeably with a crash. The two words refer to the same thing, with the only difference being that a correction is a crash when an asset drops by 10% from its peak. A crash is the umbrella body for when a financial asset plummets.
Correction vs bear market
These two terms are the same, with the only difference being the percentage. A correction is when it drops by 10% from its peak while a bear market is when it drops by 20% from its peak.
Correction vs a recession
A correction happens when a financial asset drops by 10% from its peak. A recession, on the other hand, is when an economy contracts for two straight quarters.
Useful external resources
- A stock market correction may be around the corner – Fortune
