Every day trader and investor has a goal of identifying a trend early and riding it to the end. This explains the concept of “the trend is your trend to the end.”
It is not always easy to identify a friend. Therefore, most day traders use several approaches to identify trends. In this article, we will look at some of the best strategies to help you do that.
Also, it happened during a year when millions of people died of the virus. Therefore, in this article, we will look at several ways you can identify trends early.
Please note. Identifying trends early is not a simple process. If it was, most day traders would be making a fortune, which is usually not the case.
Advantages of trend following
There are many benefits of using the trend-following strategy:
- High returns – It is possible to earn exciting returns when you are trading using the trend-following strategy. For example, people who bought stocks after the global financial crisis generated substantial returns.
- Better than reversals – Trend-following is better than trading reversals since it involves buying or shorting when there is an existing trend.
- Reduced risks – While all trading strategies have high risks, trading an existing trend exposes you to low risks.
- Reversal risks – The biggest risk is where there is a reversal. For example, you can buy a trending asset only for it to reverse.
Ways to analyze a trend
Traders employ various methods to identify trends in financial markets, enabling them to make informed investment decisions.
One commonly used approach is the utilization of indicators. These technical tools analyze historical price data and generate signals based on mathematical calculations. Popular indicators include moving averages, relative strength index (RSI), and MACD (Moving Average Convergence Divergence). By studying these indicators, traders can identify patterns and trends, such as bullish or bearish movements, and use them as a basis for their trading strategies.
Another method involves recognizing chart patterns. Traders often study price charts to identify recurring patterns, such as head and shoulders, double tops, or ascending triangles.
These patterns provide insights into the market sentiment and potential future price movements.
Furthermore, traders may consider fundamental analysis to identify trends. This approach involves analyzing economic data, company financials, news events, and other factors that may influence the market.
Strategies to spot a trend early
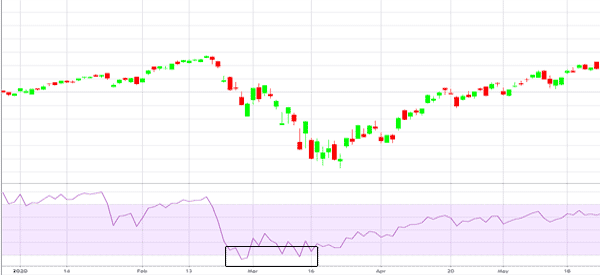
Using the Relative Strength index
A common strategy in the trading industry is about using various technical indicators to identify potential buying zones. As we have written before, there are some specific indicators that can help you see when a reversal is just getting started.
For example, some of the popular indicators are oscillators like the Relative Strength Index (RSI) and Stochastics. These ones are so popular that they are used by professional traders in Wall Street.
Ideally, during a major sell-off, a buy signal will often emerge when the RSI moves to the oversold territory.
Similarly, during a major rally, a sell signal will emerge when the RSI moves to the overbought level. As shown below, the major rally of the Nasdaq 100 index happened when the RSI moved to the oversold level.
Using the 50 EMA on the daily chart
Another approach of identifying long-term trends early is using the 50-day exponential moving average on a daily chart. After a major sell-off, a major buy signal will come when the asset moves above this MA.
The idea is that doing this will lead to more demand for the financial asset. It is worth noting that using the 50 EMA will have a delay; but it will be worth it.
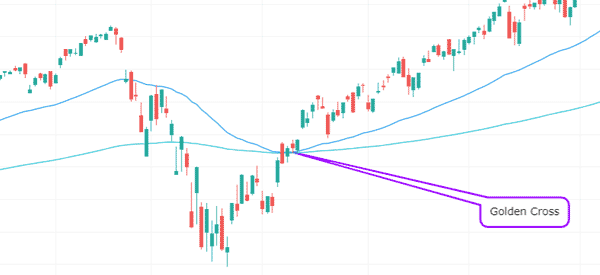
Some time ago, we looked at the concept of the golden cross. For starters, this refers to a period when the 50-day moving average and the 200-day moving average make a crossover after a long sell-off.
As we explained, after a major sell-off, the price will rebound and move above the 50-day EMA. As it does this, more buyers will start coming in, pushing the price higher. Finally, more buyers will come in after it crosses the 200-day moving average.
A good example of this is shown in the Nasdaq 100 daily chart below. In this case, you should exit the trade when the asset moves below the 50-day EMA. If the two MAs make a bearish crossover known as the death cross, it may be a signal to short an asset.
Using correlations
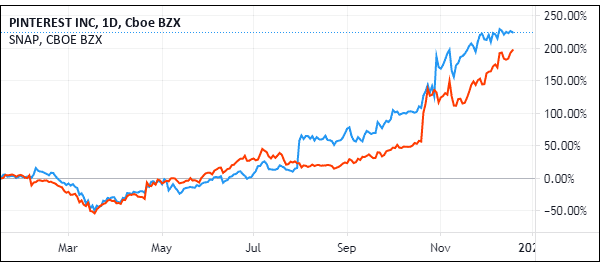
Another approach of identifying trends early is to use correlations when trading across several assets. Correlations refer to the relationships between two assets such as currencies and shares.
Historically, some assets usually move in a similar direction. Therefore, if one asset breaks out, it raises the possibility that the other one will break-out too.
A good example is what happened early in 2020 in social media stocks. As shown below, Snap shares dropped to a low of $8.30 in March. In the same period, Pinterest shares fell to $10. But Pinterest shares started to reverse early enough. To most traders, this was an ideal opportunity to buy Snap because of their close relationship.
Let’s look at a better example in currencies. In most cases, currency pairs like the AUD/USD and EUR/USD usually move in the same direction because of the dollar aspect. In the chart below, we see that, after months of consolidation, the AUD/USD broke-out in December. This could have been an opportunity to buy the pair and the EUR/USD also.
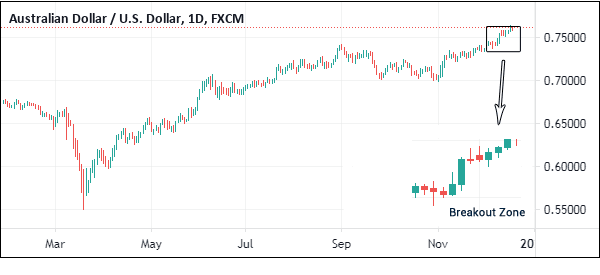
Notice that the two pairs break-out at the same level.
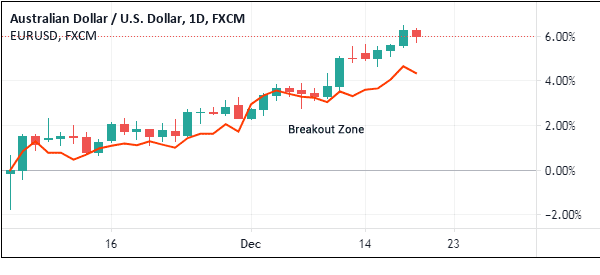
Chart patterns
Another ideal way of identifying trends early is observing the various candlestick patterns. Indeed, this is one of the best approaches to use because of how accurate it usually is. We have looked at some of the most popular chart patterns in the past.
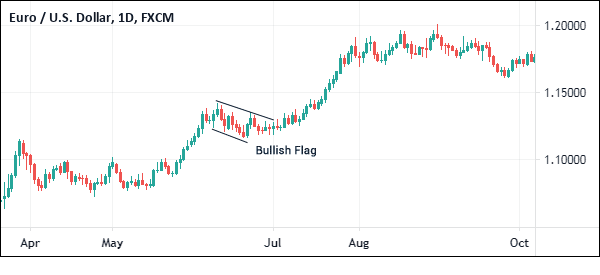
Two of the most popular patterns are flags and pennants.
A flag is a small parallel channel that happens between an already-existing trend. A pennant, on the other hand, is a small triangle pattern that happens in the middle of a trend.
These patterns usually happen as traders who are already in a trade start to question the strength of the trend. In most cases, pennants and flags are usually early signs that a trend will continue after a consolidation phase.
Candlestick patterns
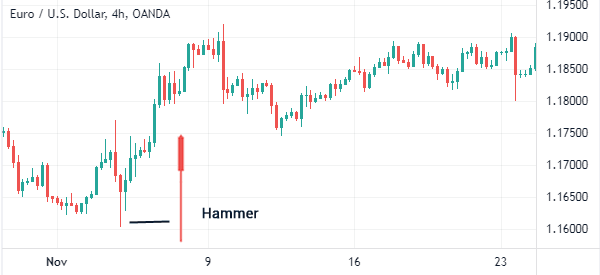
Finally, another approach to identify trends early is to use candlestick patterns, some of which we have covered before. Some of these patterns are
- bullish and bearish engulfing patterns
- hammer
- morning and evening star pattern
among others. A good example of this is shown in the EUR/USD pair shown below. The chart shows that the pair formed a hammer pattern as the new trend started.
Final thoughts
The best strategy in the financial market is to identify a new trend early and run with it. However, as mentioned above, this is usually not the easiest thing. But using the strategies shown above can make it relatively easier for you to identify these trends.
External Useful Resources
- 4 tips to spot a market trend before it gets obvious – Capital.com
